| Table of Contents |
|---|
Introduction
How to create custom charts using opCharts.
| Widget Connector | ||||||
|---|---|---|---|---|---|---|
|
Custom Charts
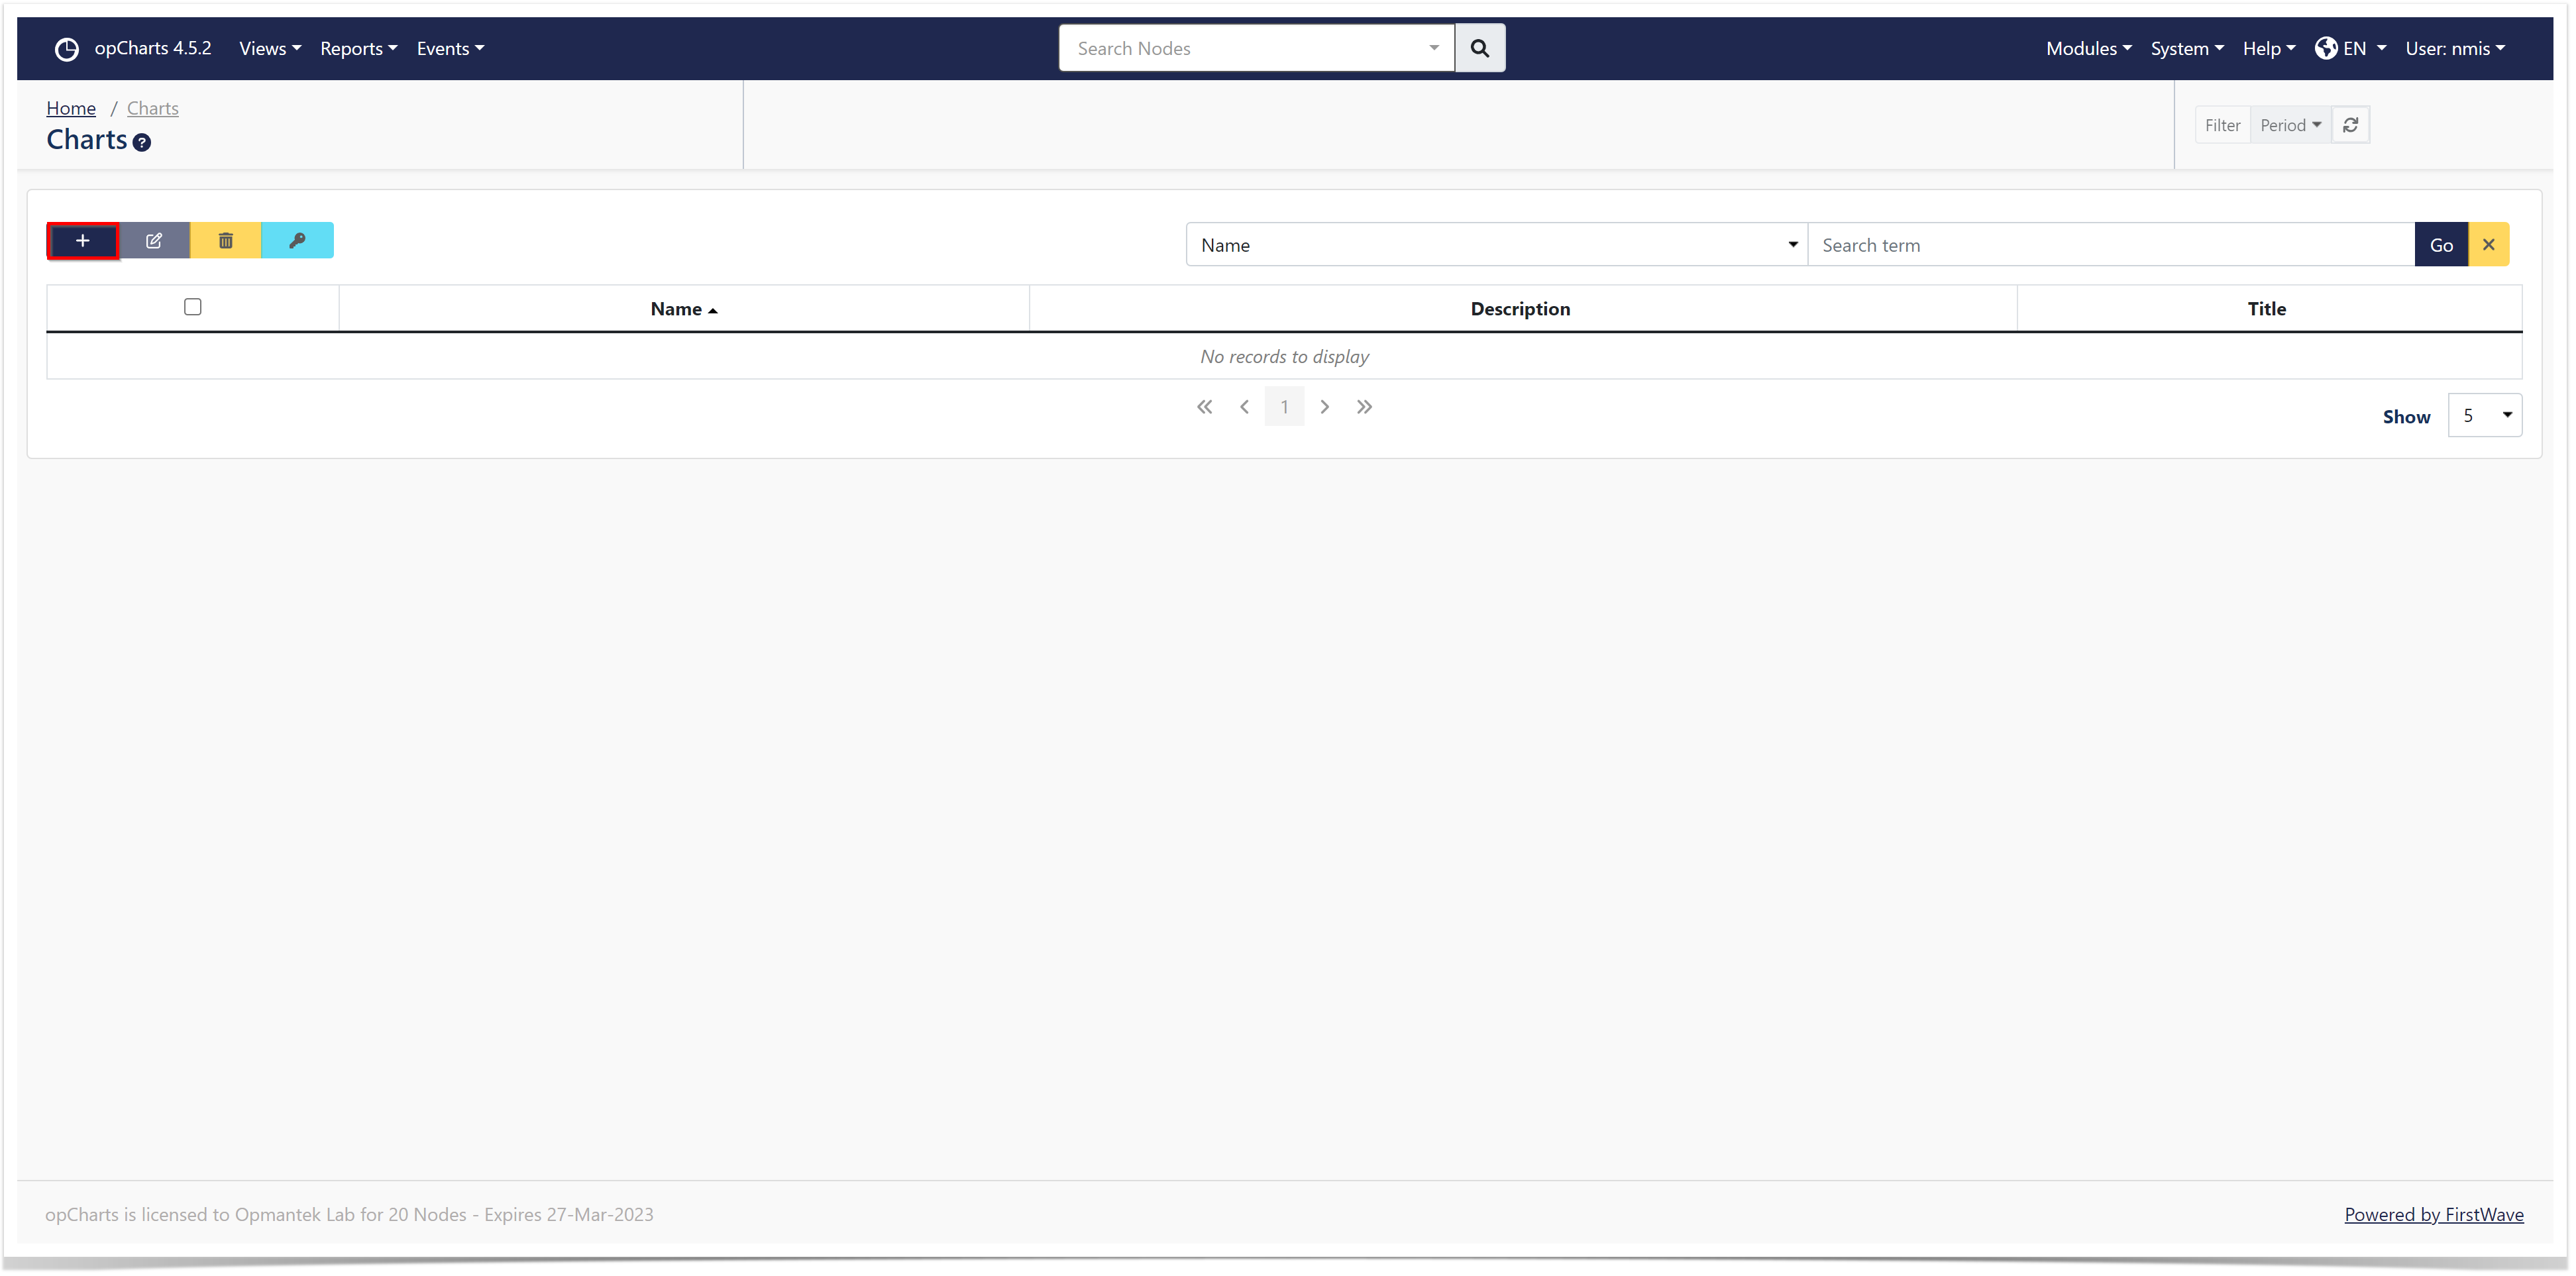
Select Charts from the opCharts menu

Press the Add ( + ) button, to add a new custom Chart.
Enter the details for the new Chart, then press the Add Dataset button to add data to the chart. For more details see Creating Charts with the opCharts Chart Editor.

Predefined Charts
In addition to building charts from NMIS' device data, opCharts includes a series of predefined charts specifically focused on providing detailed insight into system performance and metrics. Six of these charts are included on the TopN View (Select Views -> TopN from the opCharts menu bar) page. The NMIS Event log is also included on each device's detail screen.
...
TopN CPU Load
TopN Memory Used
TopN In Util
TopN Out Util
TopN Error Rates
TopN Out Discard Rates
NMIS Event Log
Adding an opCharts Chart to a Dashboard
An opCharts Chart can be added to a Dashboard in several ways, including:
...