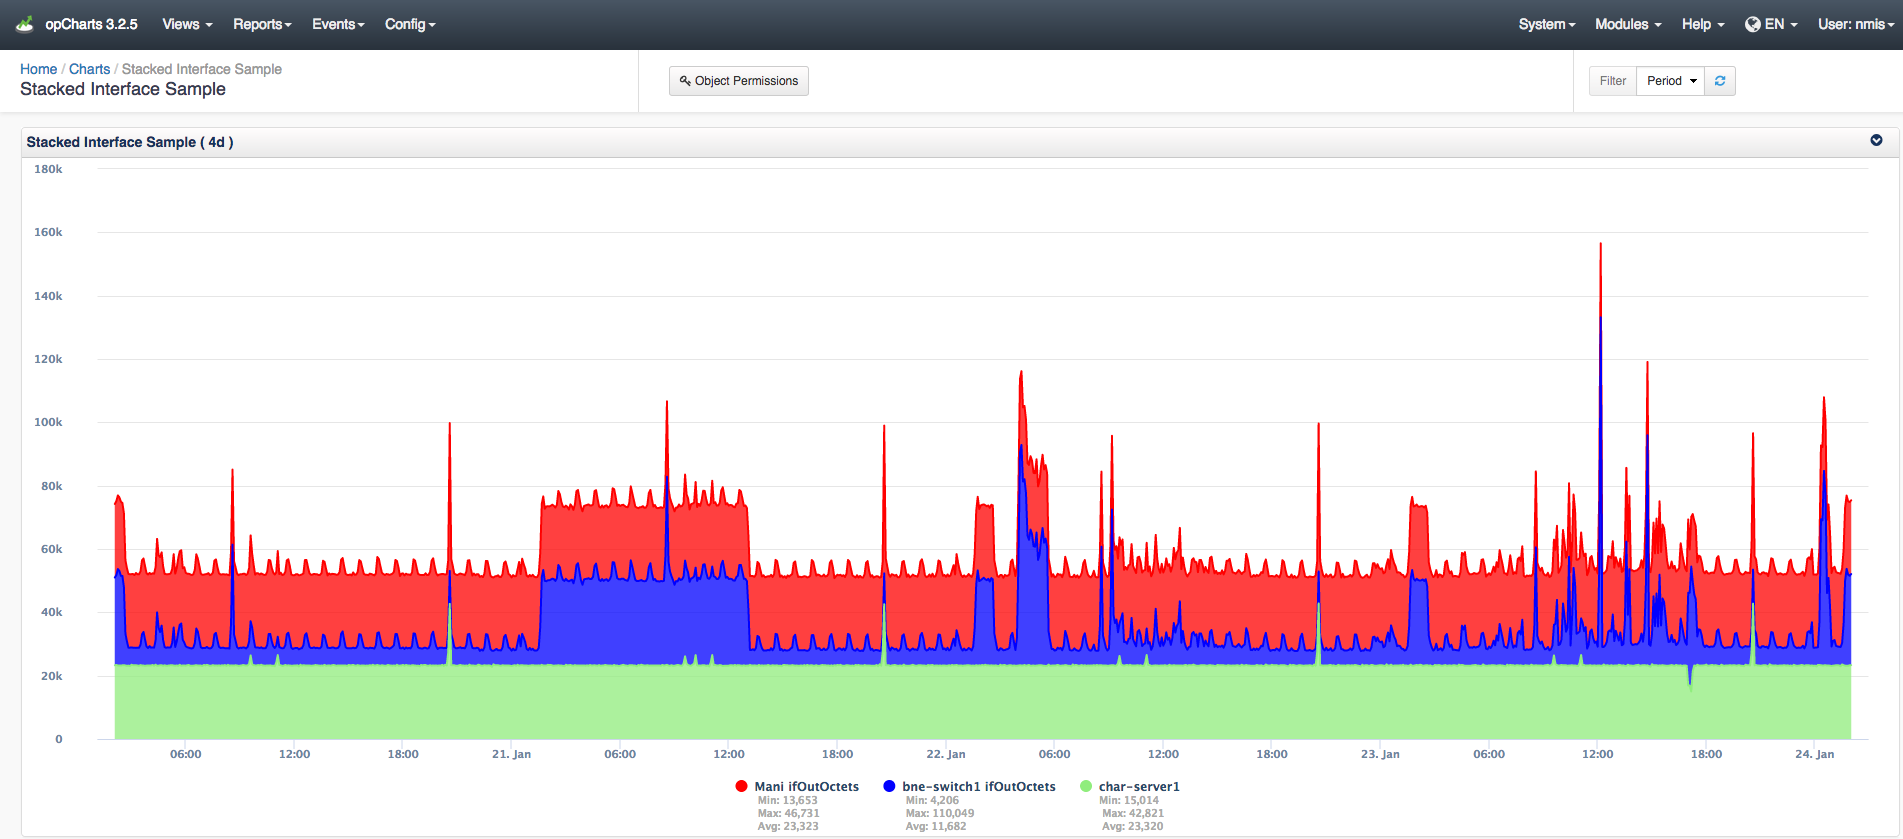
opCharts allows for stacking multiple datasets allowing you to view and compare information in one location.
More information on creating a chart in opCharts can be found here: Creating Charts with the opCharts Chart Editor
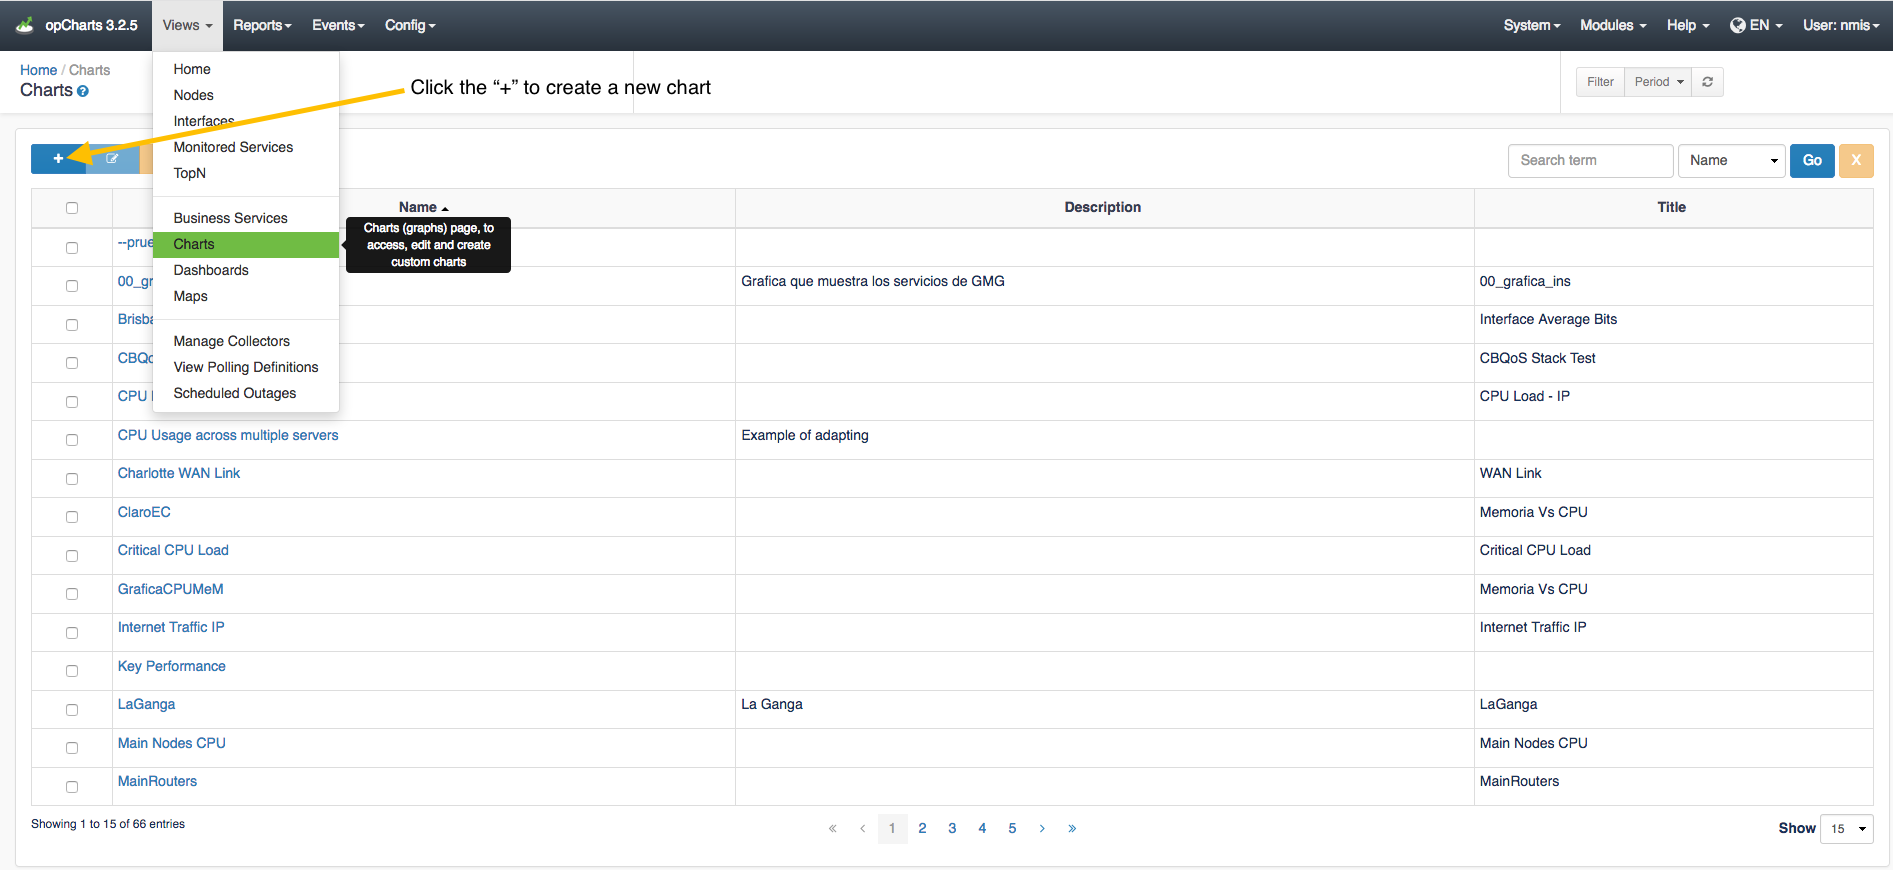
To create a chart similar to the one above navigate to Menu -> Views -> Charts then select the blue "+" icon.
This opens up the chart creation menu below. From here you can enter a name, description, title, and choose the titles and min/max of the left and right Y-Axis.
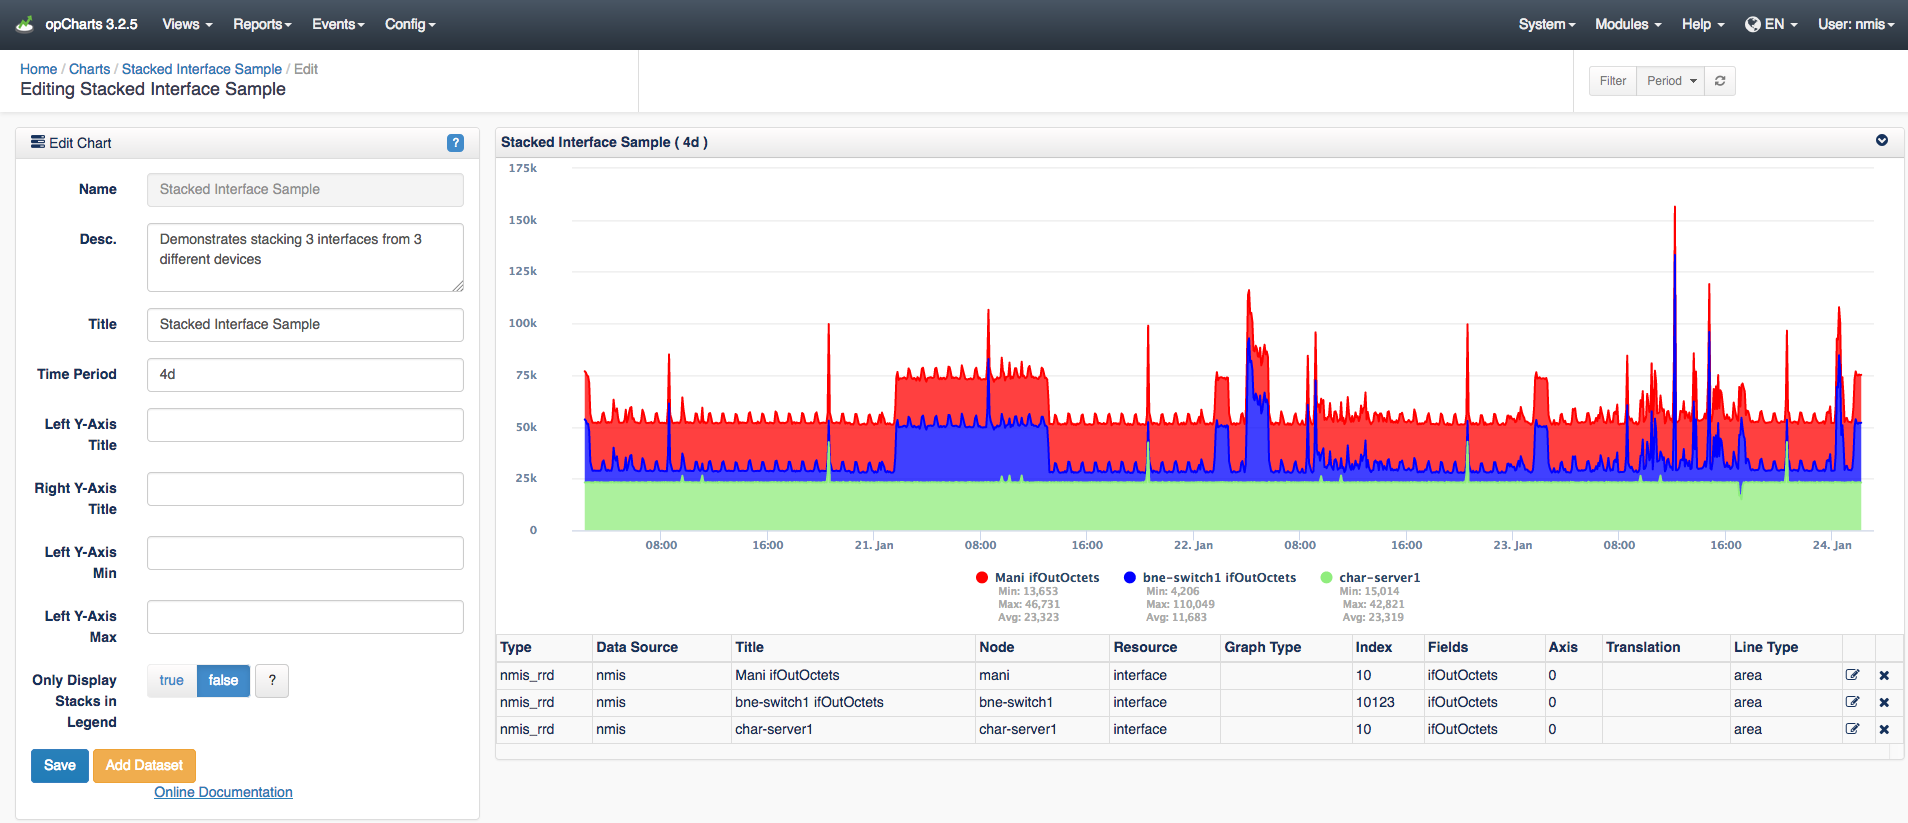
To get some information into this new chart click on the "Add Dataset" button:
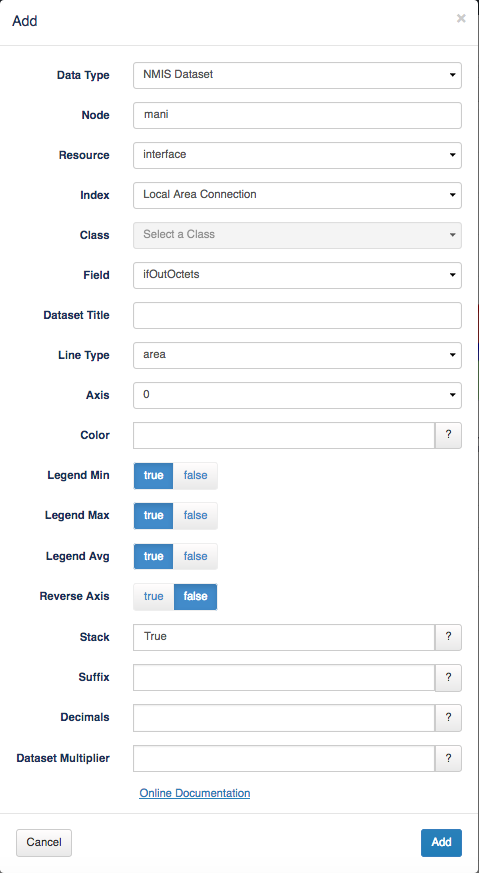
NOTE: A chart can only have one NMIS graph embedded in it and as many NMIS Dataset's as desired (the two can be mixed).
For this example we will be choosing the NMIS Dataset data type. In the node section, enter the node you wish to gather information on