Dashboards
Introduction
opCharts power is found in the ability to create, assign, and save custom dashboards designed to address specific user or functional needs. For example, you might create a series of executive-level dashboards that only reflect very abstracted data based on the status of groups of nodes and display these on both geographic and topological maps. Other dashboards, however, meant for use by Tier-I technicians, might show node or device-level details, as well as interface information overlaid on a graphical network diagram. Each of these options can be quickly, and easily built using opCharts, assigned for access by users with specific rights, and even made the default dashboards for certain users based on their role or responsibility.
The following section will describe what components can be added to a dashboard, the various methods for adding these components to a new or existing dashboard, how to organize the vial layout of the components, and how to control user access and assignment of the default dashboard.
Dashboard Components
Every dashboard is constructed from individual Components organized within a 2-dimensional grid in a logical or visually appealing way. There are four basic components available for use in opCharts. These are:
- NMIS Chart (see: NMIS Chart)
- Maps (See: Maps - Network Diagrams, Maps - Geographical Maps, Maps - Topological Diagrams),
- opCharts Chart (See: )
- SQL Charts (see: Creating a SQL Chart)
Dashboard Design Considerations
While you can add as many components as you desire to an individual Dashboard we highly recommend you adhere to the following design recommendations:
- Limit the number and overall size of each component so that the user can see the entire Dashboard without needing to scroll either horizontally or vertically
- Top-level dashboards should make use of high-level KPI metrics, grouped data and device statistics and allow the user to "drill down" from this 50,000 ft view into more detailed levels of information
- The components used on a dashboard should be directly related to the activities and questions the user will have. Avoid including superfluous, or "good to have" information, as this will become distracting and reduce the overall usability of the dashboard
- While you can stack multiple data points in an individual opCharts Chart, it is often best to limit the overall number of data points, type of data, and data ranges. This will improve the overall readability of the chart, as well as make the intention of the data more readily apparent to the operator.
Creating a New Dashboard
A new dashboard can be created from the Dashboards view; select Views -> Dashboards from the opCharts menu bar, then click the New Dashboard button located in the top-right corner.
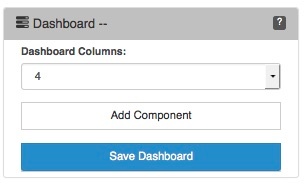
Dashboard Columns
Think of the dashboard's layout as a 2-dimensional grid. The Dashboard Columns field allow you to subdivide the usable horizontal space into equally spaced units. The horizontal width is defined by the browser window's width, but the vertical height is defined by the number and layout of the Components you add to the dashboard.
Adding a Component to a Dashboard
A Component can be added to a Dashboard either by selecting the Add to Dashboard button (The ![]() button located in the top-right corner of every Component window) or by clicking the Add Component button from within the Edit Dashboard view.
button located in the top-right corner of every Component window) or by clicking the Add Component button from within the Edit Dashboard view.
Note: A component must exist before you can add it to a Dashboard (see: Introduction to Components for more information).
Component Info
The Component info panel allows you to define the width and height of the Component's window, and the location of the Component's window within the Dashboard grid. The width and height field values are all relative to the number of columns set in Dashboard Column's field.

Next, select your Data Source Type, additional fields may appear based on the type of source you select.
Component Layout
Continue to add additional Components and arrange them in an order that presents the data clearly and with purpose


Saving the Dashboard