Creating Multiple Stacked Interfaces
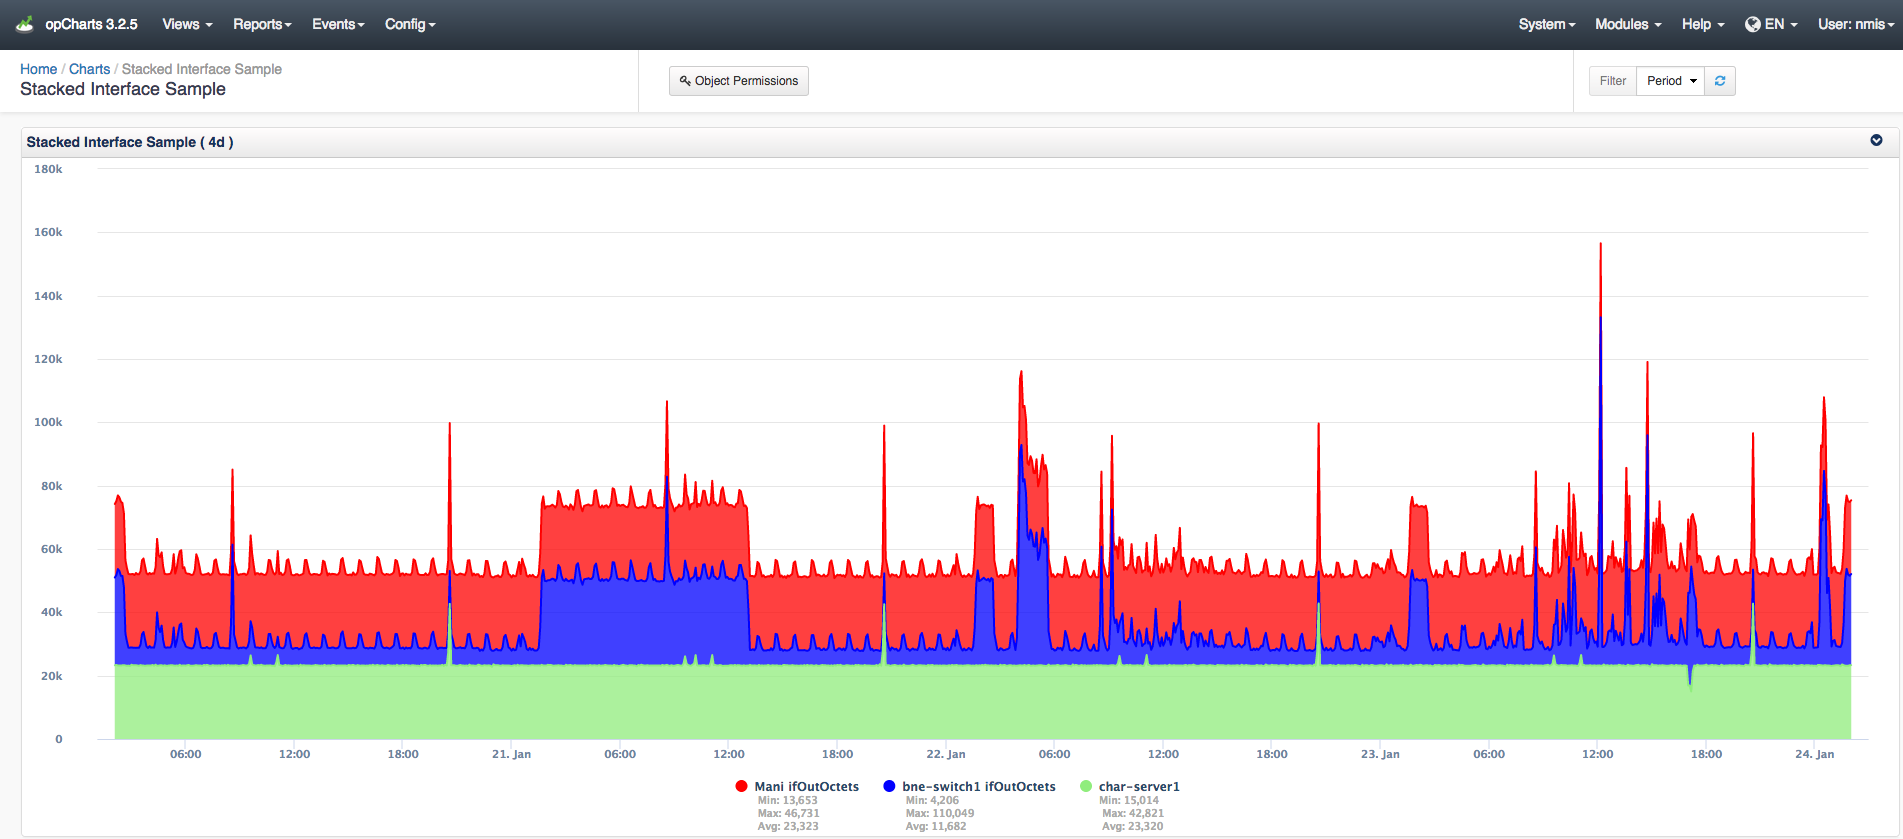
Join Paul McClendon, an Opmantek Support Engineer, as he demonstrates how to stack your interfaces using opCharts.
opCharts allows for stacking multiple datasets allowing you to view and compare information in one easy to read location.
More information on creating a chart and the different data types in opCharts can be found here: Creating Charts with the opCharts Chart Editor
Step 1 Create a new chart:
To create an interfaces chart similar to the one above navigate to Menu -> Views -> Charts then select the blue "+" icon.
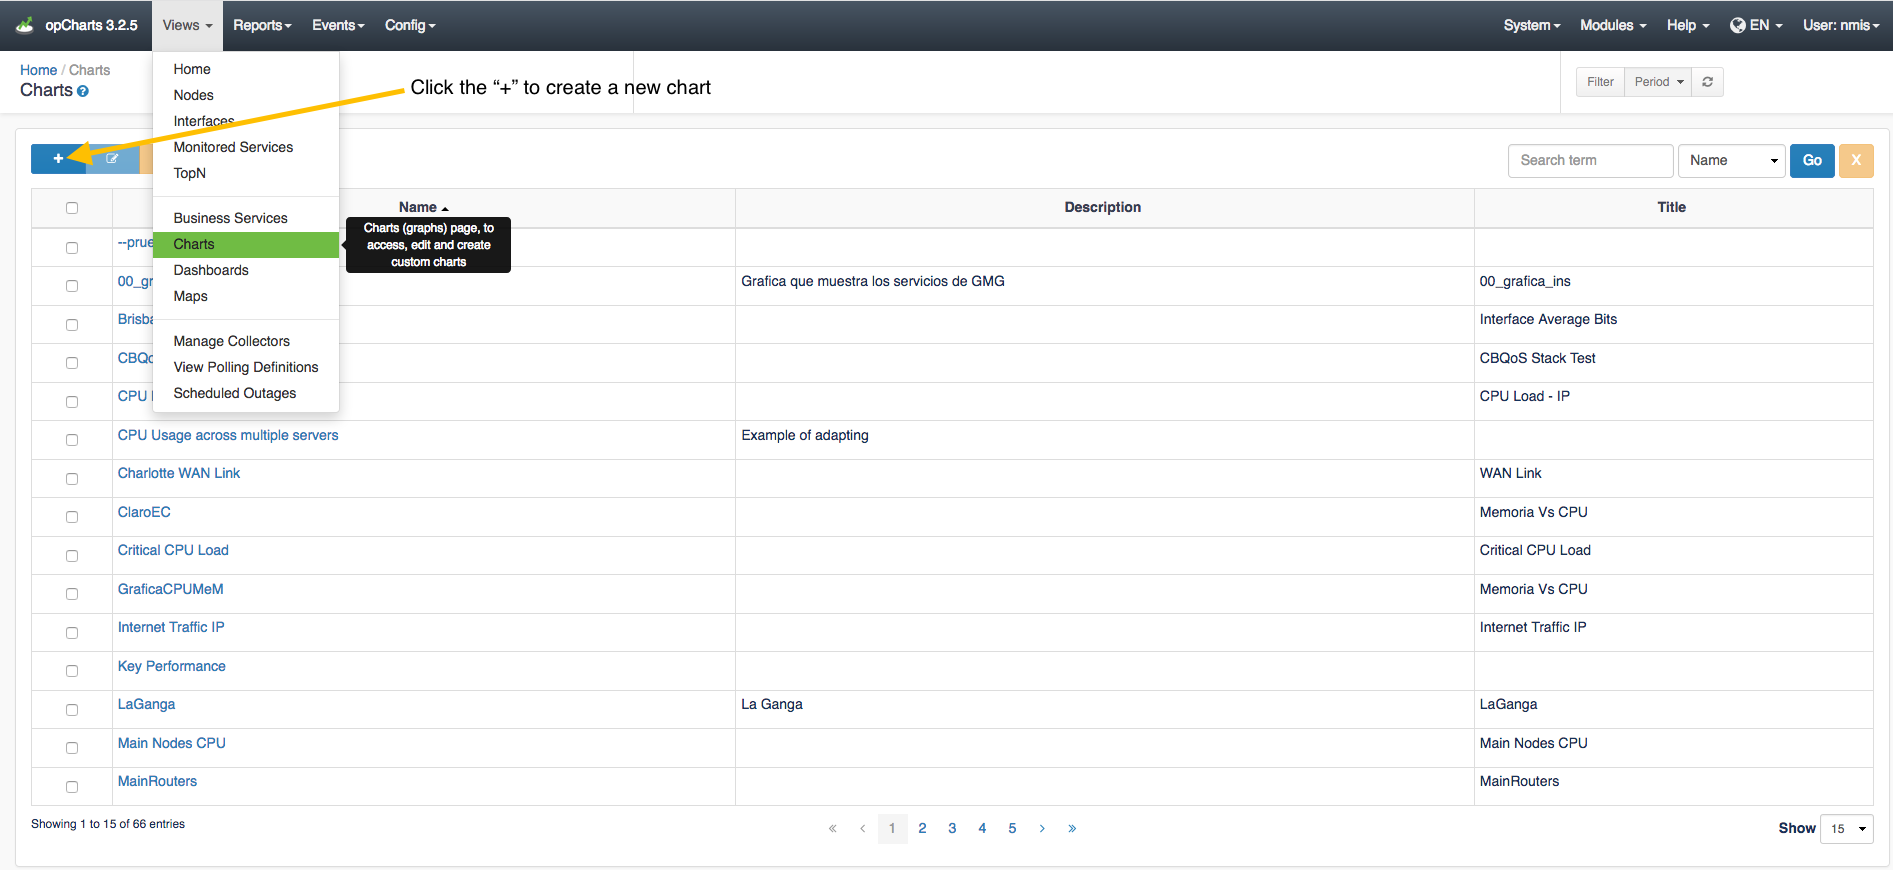
Step 2 Set name and descriptions:
This opens up the chart creation menu below. From here you can enter a name, description, title, and choose the titles and min/max of the left and right Y-Axis.
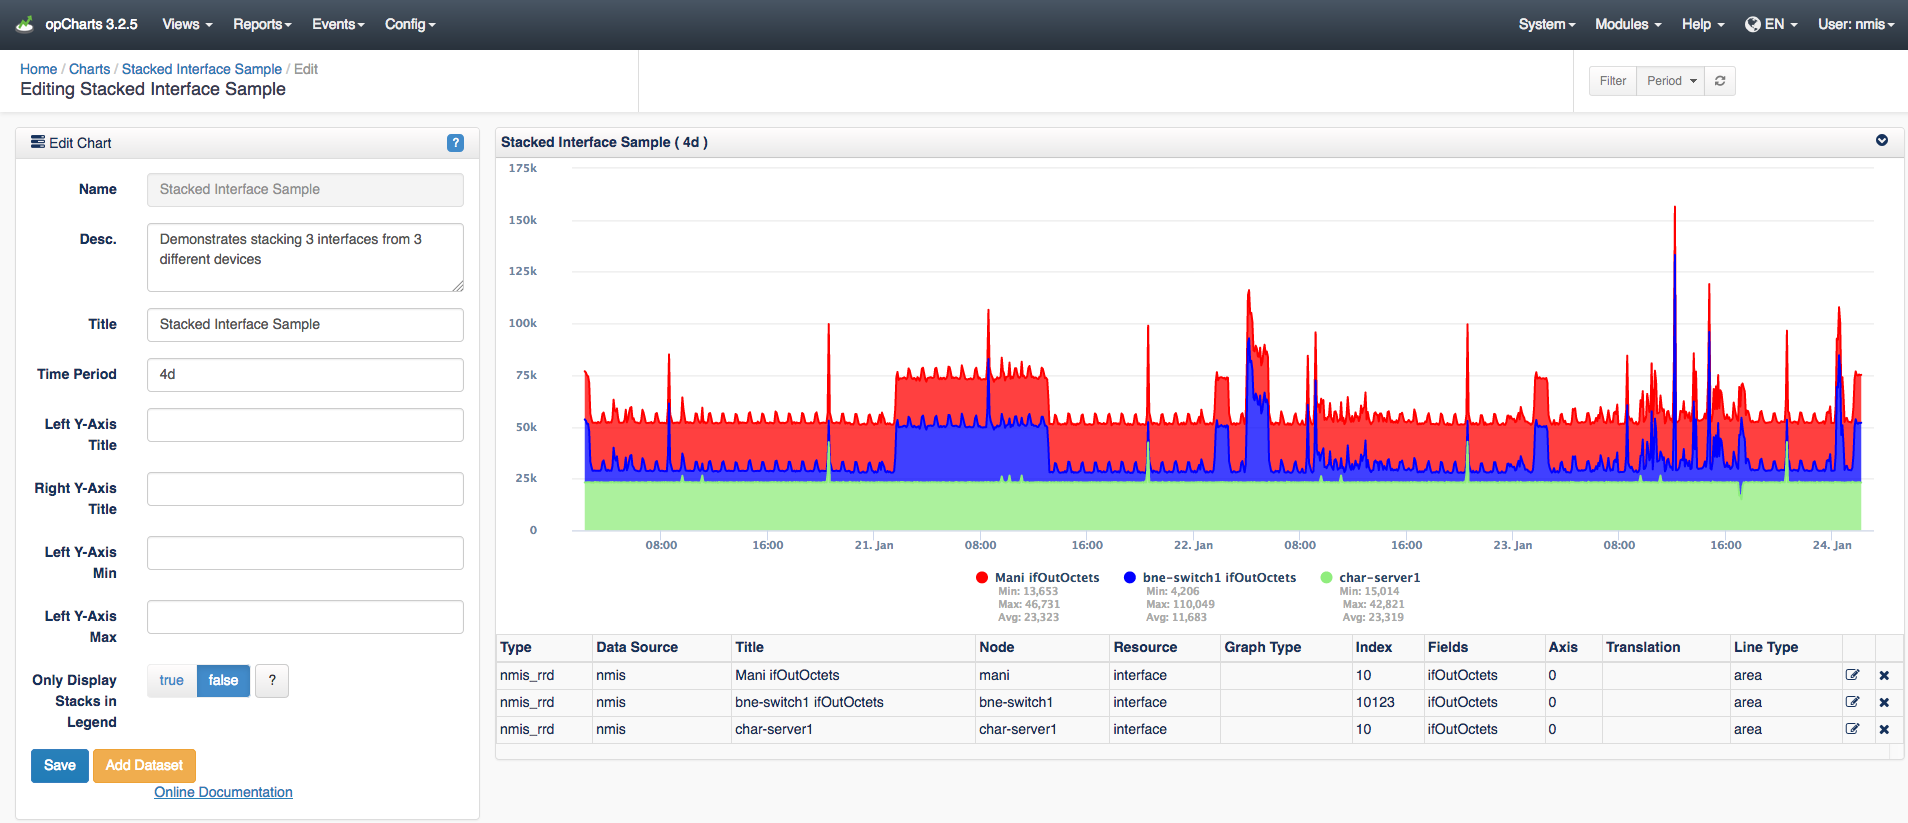
Step 3 Add a dataset:
To get some information into this new chart click on the "Add Dataset" button:
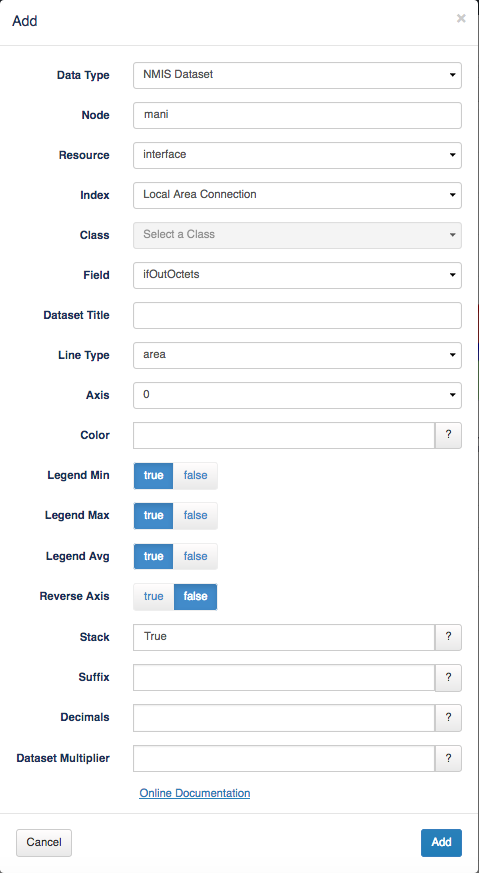
NOTE: A chart can only have one NMIS graph embedded in it and as many NMIS Dataset's as desired (the two can be mixed).
For this example we will be choosing the NMIS Dataset data type. In the node section, enter the node you wish to gather information on. The resource should be set to interface (if you want to monitor an interface, see other menu options for other chart possibilities). The index section should be the name of your interfaces connection you want to monitor. The field should be set to the field you want to view data on, in this case we are monitoring ifOutOctets.
NOTE: Stacking only works with the area line type.
Change the legend menu options to suit your needs. Be sure that the Line Type is set to area as stacking only works with the area line type. Set stack to True in the stack text bar. After this information is input to your liking continue to click Add in the bottom right corner and watch your new chart populate with information. Be sure to save the chart from the Edit Chart menu when it is complete.
Step 4 Add another interface to the stack:
To add another interface to monitor, simply repeat the above process for the different nodes you wish to view this information on.
In edit mode you can view, delete, and edit each node from the tables shown in the screen shot below.

See this Wiki page on Aggregating Circuits/Nodes Into a Single Graph for a few other examples.