
This page is intended to provide a NMIS Device Troubleshooting Process to Identify bad behaviors in collection for NMIS8/9 products, you can break it down into clear steps that anyone can follow and identify what's wrong with the device collection also if we have Gaps in Graphs for the nodes managed by NMIS.

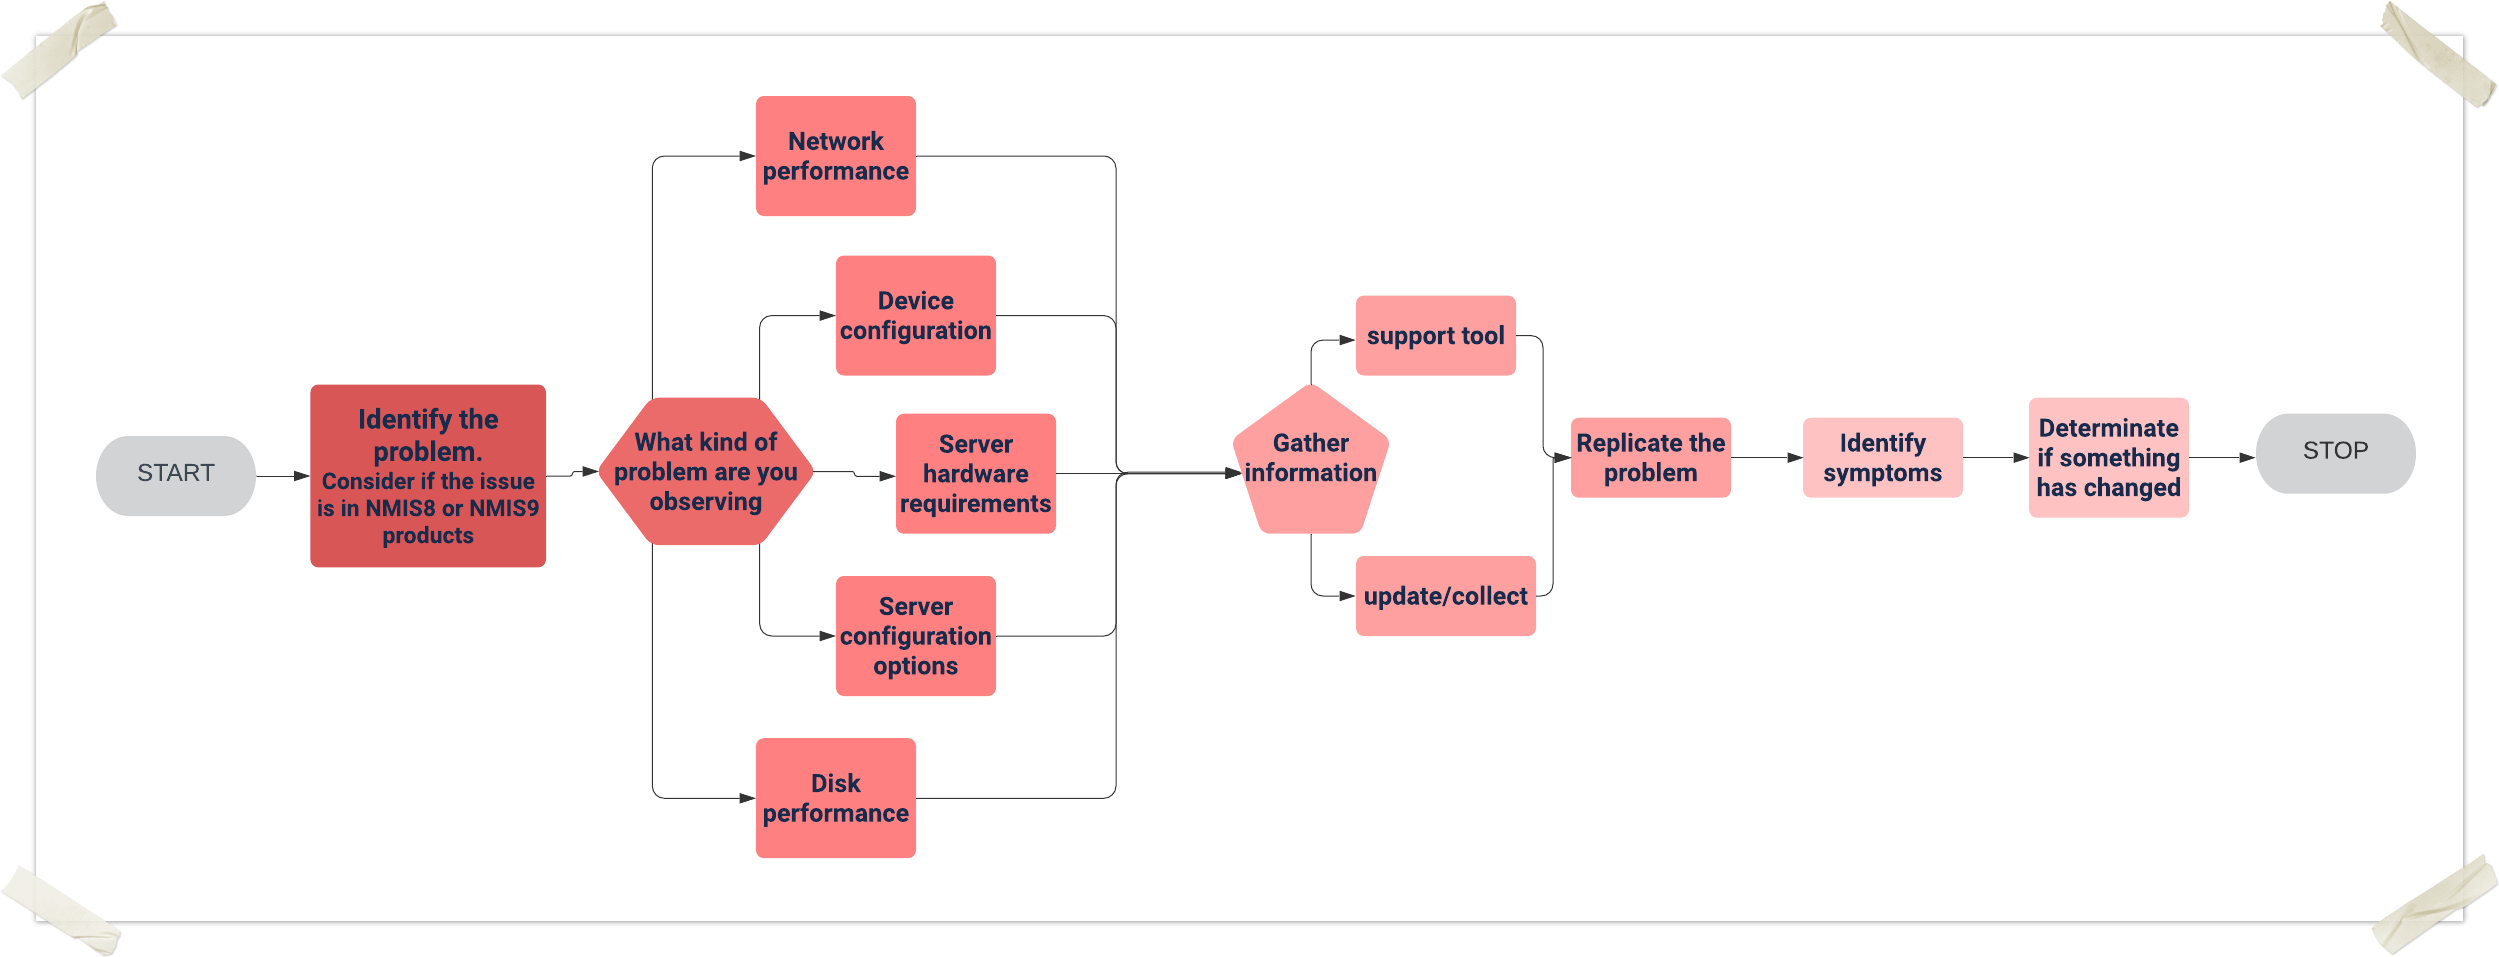
Execute the collect command for the support tool
#General collection. /usr/local/nmis8/admin/support.pl action=collect #If the file is big, we can add the next parameter. /usr/local/nmis8/admin/support.pl action=collect maxzipsize=900000000 #Device collection. /usr/local/nmis8/admin/support.pl action=collect node=<node_name> |
go to /usr/local/nmis8/var directory and collect the next files
-rw-rw---- 1 nmis nmis 4292 Apr 5 18:26 <node_name>-node.json -rw-rw---- 1 nmis nmis 2695 Apr 5 18:26 <node_name>-view.json |
obtain update/collect outputs this information will upload to the support case:
/usr/local/nmis8/bin/nmis.pl type=update node=<node_name> model=true debug=9 force=true > /tmp/node_name_update_$(hostname).log /usr/local/nmis8/bin/nmis.pl type=collect node=<node_name> model=true debug=9 force=true > /tmp/node_name_collect_$(hostname).log |
/usr/local/nmis9/admin/node_admin.pl act=dump

{node=nodeX|uuid=nodeUUID}
file=<MY PATH> everything=1 |

This section is focused on performing the review and validation of the server status in general, we will focus on verifying the historical behavior of the main metrics for the server, it is important to review all the metrics related to the good performance between the server and devices
Reachability being the pingability of device,
Availability being (in the context of network gear) the interfaces which should be up, being up or not, e.g. interfaces which are "no shutdown" (ifAdminStatus = up) should be up, so a device with 10 interfaces of ifAdminStatus = up and ifOperStatus = up for 9 interfaces, the device would be 90% available.
Health is a composite metric, made up of many things depending on the device, router, CPU, memory. Something interesting here is that part of the health is made up of an inverse of interface utilisation, so an interface which has no utilisation will have a high health component, an interface which is highly utilised will reduce that metric. So the health is a reflection of load on the device, and will be very dynamic.
The overall metric of a device is a composite metric made up of weighted values of the other metrics being collected. The formula for this is based is configurable, so you can have weight Reachability to be higher than it currently is, or lower, your choice.
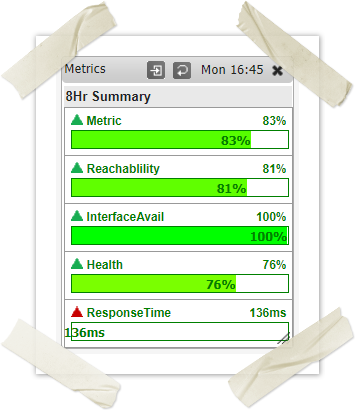
For more references go to NMIS Metrics, Reachability, Availability and Health
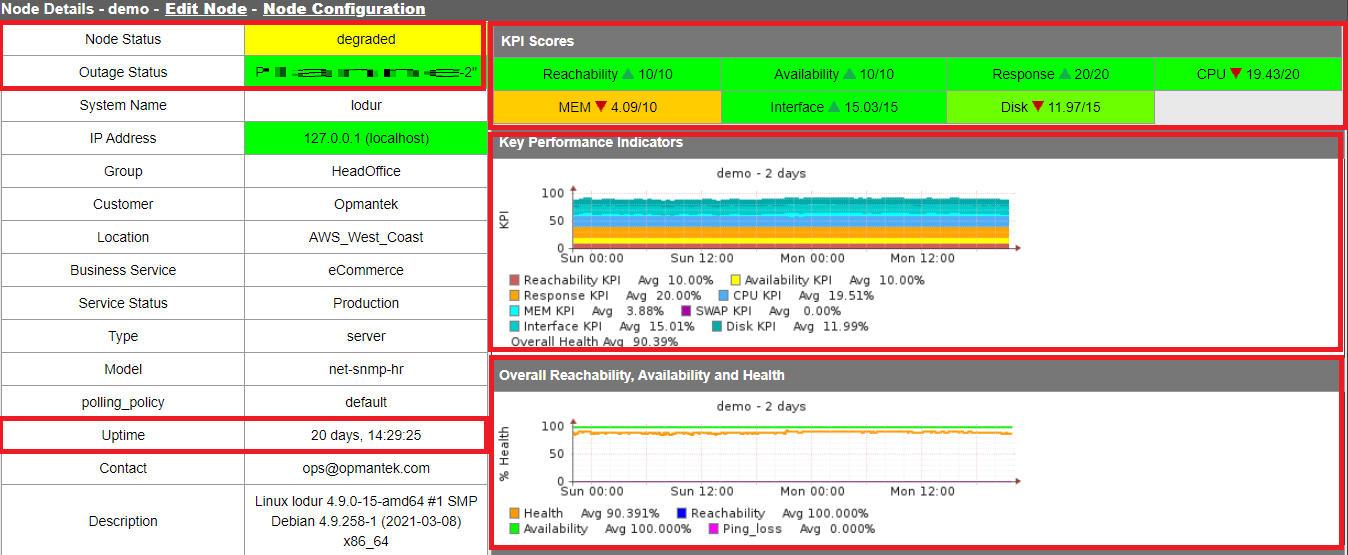
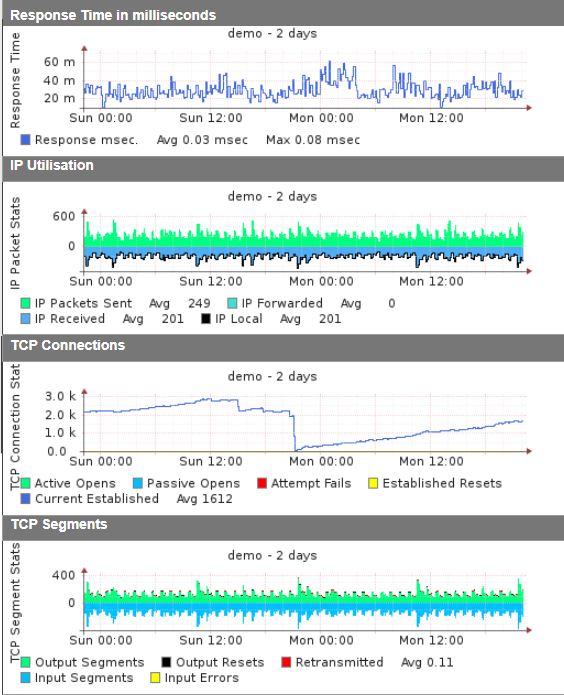
It is important to validate if the problem occurs in the network or is something related to the device configuration, in order to identify what's happening we need to validate the next commands from the console server.
Ping test, The Ping tool is used to test whether a particular host is reachable across an IP network. A Ping measures the time it takes for packets to be sent from the local host to a destination computer and back.
ping x.x.x.x #add the ip address you need to reach |
Traceroute, is a network diagnostic tool used to track in real-time the pathway taken by a packet on an IP network from source to destination, reporting the IP addresses of all the routers it pinged in between
traceroute <ip_Node> #add the ip address you need to reach |
MTR, Mtr(my traceroute) is a command-line network diagnostic tool that provides the functionality of both the ping and traceroute commands
sudo mtr -r 8.8.8.8

    [sample results below]

    HOST: endor                       Loss%   Snt   Last   Avg  Best  Wrst StDev
     1. 69.28.84.2                    0.0%    10    0.4   0.4   0.3   0.6   0.1
     2. 38.104.37.141                 0.0%    10    1.2   1.4   1.0   3.2   0.7
     3. te0-3-1-1.rcr21.dfw02.atlas.  0.0%    10    0.8   0.9   0.8   1.0   0.1
     4. be2285.ccr21.dfw01.atlas.cog  0.0%    10    1.1   1.1   0.9   1.4   0.1
     5. be2432.ccr21.mci01.atlas.cog  0.0%    10   10.8  11.1  10.8  11.5   0.2
     6. be2156.ccr41.ord01.atlas.cog  0.0%    10   22.9  23.1  22.9  23.3   0.1
     7. be2765.ccr41.ord03.atlas.cog  0.0%    10   22.8  22.9  22.8  23.1   0.1
     8. 38.88.204.78                  0.0%    10   22.9  23.0  22.8  23.9   0.4
     9. 209.85.143.186                0.0%    10   22.7  23.7  22.7  31.7   2.8
    10. 72.14.238.89                  0.0%    10   23.0  23.9  22.9  32.0   2.9
    11. 216.239.47.103                0.0%    10   50.4  61.9  50.4  92.0  11.9
    12. 216.239.46.191                0.0%    10   32.7  32.7  32.7  32.8   0.1
    13. ???                          100.0    10    0.0   0.0   0.0   0.0   0.0
14. google-public-dns-a.google.c 0.0% 10 32.7 32.7 32.7 32.8 0.0 |
The following example CLI command will return the IPS temperature information: Command:snmpwalk -v 2c -c tinapc <IP address> 1.3.6.1.4.1.10734.3.5.2.5.5 Command Explanation: In this case the CLI command breaks down as following; snmpwalk = SNMP application -v 2c = specifies what SNMP version to use (1, 2c, 3) -c tinapc = specifies the community string. Note: The IPS has the SNMP read-only community string of "tinapc" <IP address> = specifies the IP address of the IPS device 1.3.6.1.4.1.10734.3.5.2.5.5 = OID parameter for the IPS temperature information Results: SNMPv2-SMI::enterprises.10734.3.5.2.5.5.1.0 = INTEGER: 27 SNMPv2-SMI::enterprises.10734.3.5.2.5.5.2.0 = INTEGER: 50 SNMPv2-SMI::enterprises.10734.3.5.2.5.5.3.0 = INTEGER: 55 SNMPv2-SMI::enterprises.10734.3.5.2.5.5.4.0 = INTEGER: 0 SNMPv2-SMI::enterprises.10734.3.5.2.5.5.5.0 = INTEGER: 85 Results Explanation: SNMPv2-SMI::enterprises.10734.3.5.2.5.5.1.0 = INTEGER: 27 = The chassis temperature (27° Celsius / 80.6° Fahrenheit) SNMPv2-SMI::enterprises.10734.3.5.2.5.5.2.0 = INTEGER: 50 = The major threshold value for chassis temperature (50° Celsius / 122° Fahrenheit) SNMPv2-SMI::enterprises.10734.3.5.2.5.5.3.0 = INTEGER: 55 = The critical threshold value of chassis temperature (55° Celsius / 131° Fahrenheit) SNMPv2-SMI::enterprises.10734.3.5.2.5.5.4.0 = INTEGER: 0 = The minimum value of the chassis temperature range ( 0° Celsius / 32° Fahrenheit) SNMPv2-SMI::enterprises.10734.3.5.2.5.5.5.0 = INTEGER: 85 = The maximum value of the chassis temperature range (85° Celsius / 185° Fahrenheit) |
The OPMANTEK monitoring system has the polling_summary tool, this will help us determine if the server takes a long time to collect the information from the nodes and cannot complete any operation, here we can see how many nodes have a late collection and a summary of the collected and uncollected nodes.
NMIS8
/usr/local/nmis8/admin/polling_summary.pl |
NMIS9
/usr/local/nmis9/admin/polling_summary9.pl |
[root@opmantek ~]# /usr/local/nmis8/admin/polling_summary.pl node attempt status ping snmp policy delta snmp avgdel poll update pollmessage ACH-AIJ-DI-AL-SA6-0202010001-01 14:10:33 ontime up up default 328 300 422.31 22.40 17.89 ACH-AIJ-RC-ET-08K-01 --:--:-- bad_snmp up up default --- 300 403.90 10.38 14.58 snmp never successful ACH-ANA-RC-ET-08K-01 --:--:-- bad_snmp up down default --- 300 422.57 11.39 109.09 snmp never successful ACH-ATU-RC-ET-08K-01 --:--:-- bad_snmp up up default --- 300 391.99 0.97 62.88 snmp never successful ACH-CAB-DI-AL-SA6-0215010001-01 14:11:21 late up up default 484 300 5543888.62 31.06 74.21 1x late poll ACH-CAB-DR-AL-P32-01 --:--:-- bad_snmp up up default --- 300 416.30 103.46 91.28 snmp never successful ACH-CAB-GE-GM-G30-01 14:00:54 late up down default 348 300 593.93 6.06 12.53 1x late poll ACH-CAB-RC-ET-08K-01 --:--:-- bad_snmp up up default --- 300 411.74 10.69 7.31 snmp never successful ACH-CAB-TT-GM-30T-01 --:--:-- bad_snmp up down default --- 300 0.00 0.00 180.42 snmp never successful ACH-CAR-RC-ET-08K-01 14:10:20 ontime up up default 314 300 9054283.23 11.15 6.47 ACH-CAT-CN-AL-SA6-0212070008-01 14:07:39 late up up default 600 300 27253590.83 12.39 22.23 1x late poll ACH-CAZ-TT-GM-30T-01 --:--:-- bad_snmp up down default --- 300 414.85 3.11 165.32 snmp never successful ACH-CHM-DR-AL-P32-01 14:05:47 late up up default 456 300 2686074.17 118.55 148.58 1x late poll ACH-CHM-GE-GM-G20-01 --:--:-- bad_snmp up down default --- 300 413.17 4.06 238.92 snmp never successful ACH-CHM-RC-ET-09K-01 14:12:30 late up up default 633 300 1983484.93 10.49 13.07 1x late poll ACH-CHM-TT-GM-20T-01 --:--:-- bad_snmp up down default --- 300 412.17 3.61 287.80 snmp never successful ACH-COX-RC-ET-09K-01 13:51:14 late up up default 473 300 22141.04 9.54 4.10 1x late poll ACH-CSM-RC-ET-08K-01 13:51:09 late up up default 444 300 539117.26 11.25 5.31 1x late poll ACH-CSM-TT-GM-20T-01 14:08:34 late up down default 709 300 1739800.92 4.01 229.73 1x late poll ACH-HCC-CN-AL-SA6-0212030012-01 13:50:33 ontime up up default 330 300 8131293.53 23.65 23.84 ACH-HCC-RC-ET-08K-01 14:07:56 late up up default 635 300 1802552.50 0.65 1.61 1x late poll ACH-HEY-DI-AL-SA6-0211010001-01 13:50:52 late up up default 425 300 571.75 25.46 17.30 1x late poll ACH-HEY-DR-AL-P32-01 --:--:-- bad_snmp up up default --- 300 119099.96 106.25 120.92 snmp never successful ACH-HEY-GE-GM-G20-01 --:--:-- bad_snmp up down default --- 300 0.00 0.00 112.37 snmp never successful ACH-HEY-RC-ET-09K-01 --:--:-- bad_snmp up up default --- 300 404.62 11.01 7.49 snmp never successful --Snip-- --Snip-- UCA-PUC-DR-AL-P32-01 14:12:04 late up up default 524 300 124010.73 135.20 124.79 1x late poll UCA-PUC-GE-GM-G30-01 14:11:20 late up down default 475 300 3868910.82 3.68 236.48 1x late poll UCA-PUC-GE-GM-G30-02 14:12:32 late up down default 644 300 3871900.66 4.05 209.92 1x late poll UCA-PUC-RC-ET-09K-01 --:--:-- bad_snmp up up default --- 300 418.17 10.83 5.76 snmp never successful UCA-PUC-TT-GM-30A-01 --:--:-- bad_snmp up down default --- 300 397.68 4.21 215.65 snmp never successful UCA-PUC-TT-GM-30A-02 14:13:03 late up down default 720 300 329362.60 3.39 208.92 1x late poll CC_VITATRAC_GT_Z2_MAZATE 14:13:04 demoted down down default --- 300 0.00 2.22 0.80 s CC_VITATRAC_GT_Z3_COBAN 14:13:12 late up up default 618 300 4874416.57 1.91 4.46 CC_VITATRAC_GT_Z3_ESCUINTLA 14:13:12 late up up default 604 300 4902673.92 2.17 4.8 CC_VITATRAC_GT_Z7_BODEGA_MATEO 14:15:37 late up up default 642 300 3844049.73 3.25 CC_VITATRAC_GT_Z8_MIXCO 14:15:42 late up up default 634 300 4959081.87 2.47 6.70 CC_VITATRAC_GT_Z9_XELA 14:16:03 late up up default 634 300 3943302.62 8.95 58.61 CC_VITATRAC_GT_ZONA_PRADERA 14:17:47 demoted up down default 711 300 605.21 10.91 10.28 CC_VIVATEX_GT_INTERNET_VILLA_NUEVA 14:18:49 late up up default 979 300 4563376.03 1.2 CC_VOLCAN_STA_MARIA_GT_INTERNET_CRUCE_BARCENAS 14:19:44 late up up default 981 300 44late poll nmisslvcc5 14:18:55 late up up default 344 300 376209.90 2.33 1.23 totalNodes=2615 totalPoll=2267 ontime=73 pingOnly=0 1x_late=2190 3x_late=3 12x_late=1 144x_late=0 time=10:10:07 pingDown=354 snmpDown=359 badSnmp=295 noSnmp=0 demoted=348 [root@opmantek ~]# |
If the values are located in the x_late fields, we need to validate the performance of the server.
NMIS is using some important services to make the solution work, sometimes devices stop working due to some of these services are interrupted, It is always a good idea to validate if those are running, to validate this you need to execute the next commands. This in order to provide even more security, as some of these services are crucial for the operation of the operating system. On the other hand, in systems like Unix or Linux, the services are also known as daemons. In this case, it is essential to validate the services that make up the OPMANTEK monitoring system (nmis).
service mongod status service omkd status service nmisd status service httpd status service opchartsd restart service opeventsd status service opconfigd status service opflowd status service crond status #if someone of this daemons is stopped, you need to execute same commands with start/restart options. |
This section is crucial to identify or resolve device issues, you need to review some considerations depending on the number of nodes you will manage, the number of users that will be accessing the GUI's, how often does your data need to be updated? If updates are required every 5 minutes, then you will need to have the hardware to be able to accomplish these requirements, also the OS Requirements need to be well defined a good rule of thumb is to reserve 1 GB of RAM for the OS by default, High-speed drives for the data (SAN is ideal) with separate storage for mongo database, and temp files. Anywhere between 4-8 cores with a high-performing processor(s), 16-64 GB RAM should be performing well for 1k+ Nodes.
The top command shows all running processes in the server. It shows you the system information and the processes information just like up-time, average load, tasks running, no. of users logged in, no. of CPU processes, RAM utilization and it lists all the processes running/utilized by the users in your server.
top |
top - 12:50:01 up 62 days, 22:56,  5 users,  load average: 4.76, 8.03, 4.34
Tasks: 412 total,   1 running, 411 sleeping,   0 stopped,   15 zombie
Cpu(s):  6.8%us,  3.8%sy,  0.2%ni, 74.4%id, 28.2%wa,  0.1%hi,  0.5%si,  0.0%st
Mem:  20599548k total, 18622368k used,  1977180k free,   375212k buffers
Swap:  6669720k total,  3536428k used,  3133292k free, 10767256k cached

  PID USER      PR  NI  VIRT  RES  SHR S %CPU %MEM    TIME+  COMMAND
26306 root      20   0  478m 257m 1900 S  3.9  1.3   0:08.21 nmis.pl
15522 root      20   0  626m 373m 2776 S  2.0  1.9  71:45.09 opeventsd.pl
27285 root      20   0 15280 1444  884 R  2.0  0.0   0:00.01 top
    1 root      20   0 19356  308  136 S  0.0  0.0   1:07.65 init
    2 root      20   0     0    0    0 S  0.0  0.0   0:02.14 kthreadd
    3 root      RT   0     0    0    0 S  0.0  0.0  17359:19 migration/0
    4 root      20   0     0    0    0 S  0.0  0.0 252:25.86 ksoftirqd/0
    5 root      RT   0     0    0    0 S  0.0  0.0   0:00.00 stopper/0
    6 root      RT   0     0    0    0 S  0.0  0.0   2233:33 watchdog/0
    7 root      RT   0     0    0    0 S  0.0  0.0 340:35.60 migration/1
    8 root      RT   0     0    0    0 S  0.0  0.0   0:00.00 stopper/1
    9 root      20   0     0    0    0 S  0.0  0.0   5:23.87 ksoftirqd/1
10 root RT 0 0 0 0 S 0.0 0.0 214:57.35 watchdog/1 |
The very first line of the top command indicates in the order below.
top - 12:50:01 up 62 days, 22:56, 5 users, load average: 4.76, 8.03, 4.34 |
The second row provides you the following information.
Tasks: 412 total, 1 running, 411 sleeping, 0 stopped, 15 zombie |
3. CPU section.
Cpu(s): 6.8%us, 3.8%sy, 0.2%ni, 74.4%id, 28.2%wa, 0.1%hi, 0.5%si, 0.0%st |
User processes of CPU in percentage(6.8%us)
System processes of CPU in percentage(3.8%sy)
Priority upgrade nice of CPU in percentage(0.2%ni)
Percentage of the CPU not used (74.4%id)
Processes waiting for I/O operations of CPU in percentage(28.2%wa) ####### This is not good for the server performance.
Serving hardware interrupts of CPU in percentage(0.1% hi — Hardware IRQ
Percentage of the CPU serving software interrupts (0.0% si — Software Interrupts
The amount of CPU ‘stolen’ from this virtual machine by the hypervisor for other tasks (such as running another virtual machine) will be 0 on desktop and server without Virtual machine. (0.0%st — Steal Time)
These rows will provide you the information about RAM usage. It shows you total memory in use, free, buffers cached.
Mem: 20599548k total, 18622368k used, 1977180k free, 375212k buffers |
Swap: 6669720k total, 3536428k used, 3133292k free, 10767256k cached |
There is the last row to discuss CPU usage which was running currently
PID USER PR NI VIRT RES SHR S %CPU %MEM TIME+ COMMAND 26306 root 20 0 478m 257m 1900 S 3.9 1.3 0:08.21 nmis.pl 15522 root 20 0 626m 373m 2776 S 2.0 1.9 71:45.09 opeventsd.pl 27285 root 20 0 15280 1444 884 R 2.0 0.0 0:00.01 top |
It is important to monitor this commando to see if the server is working properly executing all the internal processes need.
In order to tell the server, how to manage the devices configured we need to validate that all the configuration items are well set, you can see the server performances while collecting information going to the section, system>Host Diagnostics> NMIS Runtime Graph
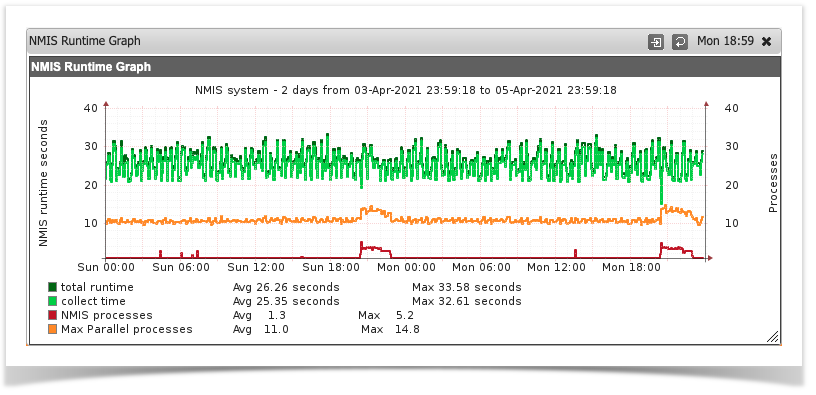
if the total runtime/collect time is too high, we need to adjust the collect parameters depending on the manager version you are using.
The main NMIS 8 process is called from different cron jobs to run different operations: collect, update, summary, clean jobs, etc. As an example:
* * * * * root /usr/local/nmis8/bin/nmis.pl type=collect abort_after=60 mthread=true ignore_running=true; |
The cron configuration can be found in /etc/crond.d/nmis.
For a collect or an update, the main thread is set up by default to fork worker processes to perform the requested operations using threads and improving performance. One of each operation will run every minute (by default), and will process as many nodes as the collect polling cycle is set up to process.
There are some important configurations that affect performace:
Also, this option needs to always have also the option mthreads=true.
nmis8/bin/nmis.pl type=collect abort_after=60 mthread=true ignore_running=true; |
CROND file configuration (NMIS) and Config.nmis
Here we will proceed to verify the data collection configuration towards the devices, so we validate the Collect, maxthreads and mthread parameters.
In the NMIS Cron file we see the following:
###################################################### # NMIS8 Config ###################################################### # Run Full Statistics Collection */5 * * * * root /usr/local/nmis8/bin/nmis.pl type=collect maxthreads=100 mthread=true */5 * * * * root /usr/local/nmis8/bin/nmis.pl type=services mthread=true # ###################################################### # Optionally run a more frequent Services-only Collection # */3 * * * * root /usr/local/nmis8/bin/nmis.pl type=services mthread=true ###################################################### # Run Summary Update every 2 minutes */2 * * * * root /usr/local/nmis8/bin/nmis.pl type=summary |
We proceed to verify that the mthread value is activated and that the maxthreads has the same value in the Config.nmis file
'nmis_group' => 'nmis', 'nmis_host' => 'nmissTest_OMK.omk.com', 'nmis_host_protocol' => 'http', 'nmis_maxthreads' => '100', 'nmis_mthread' => 'false', 'nmis_summary_poll_cycle' => 'false', 'nmis_user' => 'nmis', |
We can see that the mthread value is deactivated and that the maxthreads value does correspond to the same one declared in the nmis cron, so we proceed to activate it and perform an update and collect to the node.
/usr/local/nmis8/bin/nmis.pl type=update node=<Name_Node> force=true /usr/local/nmis8/bin/nmis.pl type=collect node=<Name_Node> force=true |
Note: If these values declared in the cron and in the Conf.nmis file do not work, it is recommended to do the following:
# Ejemplo 1: /usr/local/nmis8/bin/nmis.pl type=collect abort_after=300 mthread=true maxthreads=100 ignore_running=true # Ejemplo 2 /usr/local/nmis8/bin/nmis.pl type=collect abort_after=240 mthread=true maxthreads=100 ignore_running=true |
The value of the maxthreads parameter (it is recommended to try between 50, 80 and 100) must be the same in both files (cron nmis and conf.nmis)
Apply the Update and Collect commands at the end of each test and verify the behavior in the NMIS GUI, this consists of reviewing the NMIS Runtime Graph, Network_summary and Polling_summary.
In low memory environments lowering the number of omkd workers provides the biggest improvement instability, even more than tuning mongod.conf does. The default value is 10, but in an environment, with low user concurrency, it can be decreased to 3-5.
omkd_workers |
Setting also omkd_max_requests, will help to have the threads restart gracefully before they get too big.
omkd_max_requests |
Process size safety limiter: if a max is configured and it's >= 256 mb and we're on linux, then run a process size check every 15 s and gracefully shut down the worker if over size.
omkd_max_memory |
Process maximum number of concurrent connections, defaults to 1000:
omkd_max_clients |
The performance logs are really useful for debugging purposes, but they also can affect performance. So, it is recommended to turn them off when they are not necessary:
omkd_performance_logs => false |
NMIS8
NMIS 8 - Configuration Options for Server Performance Tuning
NIMS9
NMIS 9 - Configuration Options for Server Performance Tuning
This section is dedicated to identifying when the server is not writing all the data for the devices, this can have as a result graph with interruptions, so this causes level 2 problems (Severe impact - Unreliable production system) or even in some occasions level 1 (Critical for the business, complete loss of service, loss of data) to the client, so it is essential to determine what is happening and provide a diagnosis.
Server status at Service level.
The monitoring service is affected slowly when accessing the GUI, and its main impact is centered on the failure to execute collect and updates to the nodes, the CPUs are saturated and the monitoring system executes the collection of information every minute or 5 minutes, the system being overloaded is forced to kill the processes affecting the storage of the information of the nodes in the RRD's files

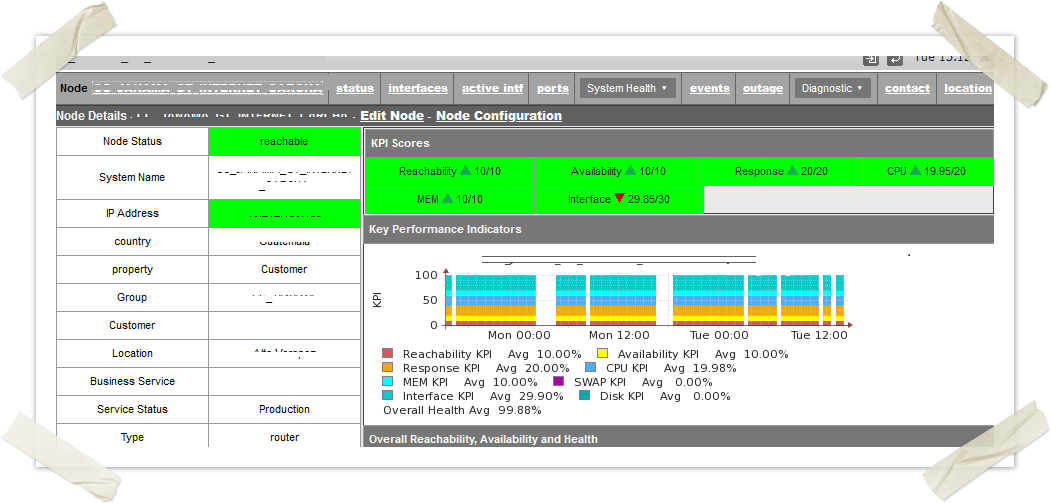
Node View in NMIS:
You will be able to visualize device graphs with gaps, this is an example of how to recognize this behavior.
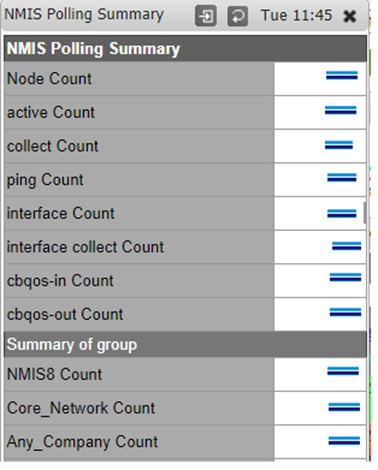
NMIS Polling Summary (menu: System> Host Diagnostics> NMIS Polling Summary)
The Polling Summary option that NMIS is providing is very useful since in it we can see the details of the collection time of the nodes, active nodes, collected nodes, etc. These values must be according to the number of monitored nodes, likewise, the collection time must be within the range of minutes configured in the nmis crond.
Files system
It is important to validate that the file systems are free, if we have a FS full the tool will stop to work:
echo -e "\n \e[31m Información de espacio en el disco \e[0m" && df -h && echo -e "\n\n \e[31m Información de uso de RAM \e[0m" && free -m && echo -e "\n\n \e[31m Detalle de discos \e[0m" && fdisk -l
Resultado:
[root@opmantek ~]# echo -e "\n \e[31m Información de espacio en el disco \e[0m" && df -h && echo -e "\n\n \e[31m Información de uso de RAM \e[0m" && free -m && echo -e "\n\n \e[31m Detalle de discos \e[0m" && fdisk -l Información de espacio en el disco Filesystem Size Used Avail Use% Mounted on /dev/mapper/vg_nmis64-lv_root 59G 2.7G 54G 5% / tmpfs 3.9G 0 3.9G 0% /dev/shm /dev/sda1 477M 109M 343M 25% /boot /dev/mapper/vg_nmis64_data-lv_data 321G 11G 295G 4% /data /dev/mapper/vg_nmis64-lv_var 147G 1.5G 138G 2% /var Información de uso de RAM total used free shared buffers cached Mem: 7984 6891 1093 0 216 1077 -/+ buffers/cache: 5596 2387 Swap: 4071 1589 2482 Detalle de discos Disk /dev/sda: 536.9 GB, 536870912000 bytes 255 heads, 63 sectors/track, 65270 cylinders Units = cylinders of 16065 * 512 = 8225280 bytes Sector size (logical/physical): 512 bytes / 512 bytes I/O size (minimum/optimal): 512 bytes / 512 bytes Disk identifier: 0x0008cec3 Device Boot Start End Blocks Id System /dev/sda1 * 1 64 512000 83 Linux Partition 1 does not end on cylinder boundary. /dev/sda2 64 5222 41430016 8e Linux LVM /dev/sda3 5222 42570 299997810 8e Linux LVM /dev/sda4 42570 65256 182225295 8e Linux LVM Disk /dev/sdb: 42.9 GB, 42949672960 bytes 255 heads, 63 sectors/track, 5221 cylinders Units = cylinders of 16065 * 512 = 8225280 bytes Sector size (logical/physical): 512 bytes / 512 bytes I/O size (minimum/optimal): 512 bytes / 512 bytes Disk identifier: 0x00000000 Disk /dev/mapper/vg_nmis64-lv_root: 64.4 GB, 64432898048 bytes 255 heads, 63 sectors/track, 7833 cylinders Units = cylinders of 16065 * 512 = 8225280 bytes Sector size (logical/physical): 512 bytes / 512 bytes I/O size (minimum/optimal): 512 bytes / 512 bytes Disk identifier: 0x00000000 Disk /dev/mapper/vg_nmis64-lv_swap: 4269 MB, 4269801472 bytes 255 heads, 63 sectors/track, 519 cylinders Units = cylinders of 16065 * 512 = 8225280 bytes Sector size (logical/physical): 512 bytes / 512 bytes I/O size (minimum/optimal): 512 bytes / 512 bytes Disk identifier: 0x00000000 Disk /dev/mapper/vg_nmis64_data-lv_data: 350.1 GB, 350140497920 bytes 255 heads, 63 sectors/track, 42568 cylinders Units = cylinders of 16065 * 512 = 8225280 bytes Sector size (logical/physical): 512 bytes / 512 bytes I/O size (minimum/optimal): 512 bytes / 512 bytes Disk identifier: 0x00000000 Disk /dev/mapper/vg_nmis64-lv_var: 160.3 GB, 160314687488 bytes 255 heads, 63 sectors/track, 19490 cylinders Units = cylinders of 16065 * 512 = 8225280 bytes Sector size (logical/physical): 512 bytes / 512 bytes I/O size (minimum/optimal): 512 bytes / 512 bytes Disk identifier: 0x00000000 [root@opmantek ~]# |
%wa- It is important to review the load average and iowait, if we see this values are high that represents problems for the server

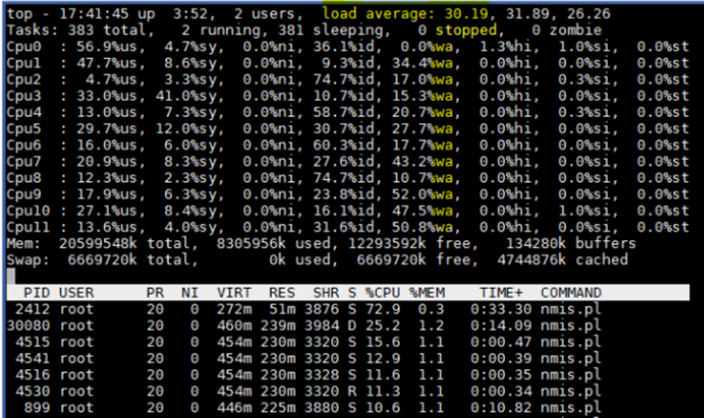
The ps command provides us with information about the processes of a Linux or Unix system.
Sometimes tasks can hang, go into a closed-loop, or stop responding. For other reasons, or they may continue to run, but gobble up too much CPU or RAM time, or behave in an equally antisocial manner. Sometimes tasks need to be removed as a mercy to everyone involved. The first step. Of course, it is to identify the process in question.
Processes in a "D" or uninterruptible sleep state are usually waiting on I/O.
[root@8/ root 13417 0.6 0.8 565512 306812 ? D 10:38 0:37 \_ opmantek.pl webserver - root 17833 9.8 0.0 0 0 ? Z 12:19 0:00 \_ [opeventsd.pl] <defunct> root 17838 10.3 0.0 0 0 ? Z 12:19 0:00 \_ [opeventsd.pl] <defunct> root 17842 10.6 0.0 0 0 ? Z 12:19 0:00 \_ [opeventsd.pl] <defunct>nmisslvcc5 log]# ps -auxf | egrep " D| Z" Warning: bad syntax, perhaps a bogus '-'? See /usr/share/doc/procps-3.2.8/FAQ root 1563 0.1 0.0 0 0 ? D Mar17 10:47 \_ [jbd2/dm-2-8] root 1565 0.0 0.0 0 0 ? D Mar17 0:43 \_ [jbd2/dm-3-8] root 1615 0.3 0.0 0 0 ? D Mar17 39:26 \_ [flush-253:2] root 1853 0.0 0.0 29764 736 ? D<sl Mar17 0:04 auditd root 17898 0.0 0.0 103320 872 pts/5 S+ 12:20 0:00 | \_ egrep D| Z apache 17856 91.0 0.2 205896 76212 ? D 12:19 0:01 | \_ /usr/bin/perl /usr/local/nmis |
The dd command is very sensitive regarding the parameters it handles since it can cause serious problems on your server, OMK uses this command to obtain and measure server performance and latency, so with this, we determine that the writing speed and reading of the disc.
[root@SRVLXLIM32 ~]# dd if=/dev/zero of=/data/omkTestFile bs=10M count=1 oflag=direct 1+0 records in 1+0 records out 10485760 bytes (10 MB) copied, 0.980106 s, 15.0 MB/s [root@SRVLXLIM32 ~]# dd if=/data/omkTestFile of=/dev/null 2>&1 20480+0 records in 20480+0 records out 10485760 bytes (10 MB) copied, 6.23595 s, 1.7 MB/s [root@SRVLXLIM32 ~]# |

Parameters:
0.0X s to be correct.
0.X s, there is a warning (and there would be issue)
X.0 s would be critical (and there would be a problem).
Please note that one gigabyte was written for the test and 47 MB/s was the performance and the time it took to write the block was 0.223301 seconds from the server for this test.
Where:
This command helps us to monitor the load of an input and output device, observing the time that the devices are active in relation to the average of their transfer rates. It can also be used to compare activity between disks.
Using 100% iowait / Utilization indicates that there is a problem and in most cases a big problem that can even lead to data loss. Essentially, there is a bottleneck somewhere in the system. Perhaps one of the drives is preparing to die / fail.
OMK recommends executing the command in the following way, since this gives a better scenario than what happens with the disks.
Example: the command shows 5 samples made every 3 seconds, what we want is that at least 3 of the samples reflect data within the stable range for the server, otherwise this indicates that there is a problem with the disks.

[root@opmantek ~]# iostat -xtc 3 5
Linux 2.6.32-754.28.1.el6.x86_64 (opmantek)     04/05/2021      _x86_64_        (8 CPU)

04/05/2021 09:23:40 PM
avg-cpu:  %user   %nice %system %iowait  %steal   %idle
           12.47    0.00    0.73   10.53    0.00   86.72

Device:         rrqm/s   wrqm/s     r/s     w/s   rsec/s   wsec/s avgrq-sz avgqu-sz   await r_await w_await  svctm  %util
sda               0.00     0.00    4.50   35.50   148.00   452.00    15.00   110.98 4468.74  274.22 5000    0.60    100.00
sdb               0.00    42.50    0.00    6.50     0.00   392.00    60.31     0.13   20.00    0.00   20    0.34    92.12
dm-0              0.00     0.00    0.00    0.00     0.00     0.00     0.00     0.00    0.00    0.00    0    0.65    56.00
dm-1              0.00     0.00    0.00    0.00     0.00     0.00     0.00     0.00    0.00    0.00    0    0.86    10.50
dm-2              0.00     0.00    4.50   52.00   140.00   416.00     9.84   149.56 5229.59  274.22 5658    0.21    25.03
dm-3              0.00     0.00    0.00    0.50     0.00     4.00     8.00    66.00    0.00    0.00    0    0.45    14.40


04/05/2021 09:23:43 PM
avg-cpu:  %user   %nice %system %iowait  %steal   %idle
           18.17    0.00    5.29    6.31    0.00   76.82

Device:         rrqm/s   wrqm/s     r/s     w/s   rsec/s   wsec/s avgrq-sz avgqu-sz   await r_await w_await  svctm  %util
sda               0.00    50.00    9.50   19.00   596.00   260.00    30.04   130.41 2569.47  283.11 3712     0.60    92.36
sdb               0.00    36.50    0.50   59.00     8.00   764.00    12.97    25.34  425.82   18.00  429     0.25    78.82
dm-0              0.00     0.00    0.00    0.00     0.00     0.00     0.00     0.00    0.00    0.00    0     0.23    92.45
dm-1              0.00     0.00    0.00    0.00     0.00     0.00     0.00     0.00    0.00    0.00    0     0.86    88.93
dm-2              0.00     0.00    8.00  163.50   440.00  1308.00    10.19   240.76  966.94  337.38  997     0.37    68.28
dm-3              0.00     0.00    0.00   33.00     0.00   264.00     8.00    48.31    0.00    0.00    0     0.18    12.75

04/05/2021 09:23:46 PM
avg-cpu:  %user   %nice %system %iowait  %steal   %idle
           2.50    0.00    1.21    11.37    0.00   75.56

Device:         rrqm/s   wrqm/s     r/s     w/s   rsec/s   wsec/s avgrq-sz avgqu-sz   await r_await w_await  svctm  %util
sda               0.00     0.00    9.50   18.00   268.00   220.00    17.75   112.91 1763.73  143.42 2618     0.85    100.00
sdb               0.00    10.00    2.00    1.50   112.00    92.00    58.29     0.01    3.86    6.25    0     0.94     97.54
dm-0              0.00     0.00    0.00    0.00     0.00     0.00     0.00     0.00    0.00    0.00    0     0.45     75.39
dm-1              0.00     0.00    0.00    0.00     0.00     0.00     0.00     0.00    0.00    0.00    0     0.78     24.96
dm-2              0.00     0.00   13.50   11.50   552.00    92.00    25.76   185.21 3029.96  101.85 6467     0.25     67.18
dm-3              0.00     0.00    0.00    0.00     0.00     0.00     0.00     0.00    0.00    0.00    0     0.86     43.91

04/05/2021 09:23:49 PM
avg-cpu:  %user   %nice %system %iowait  %steal   %idle
           12.10    0.00    7.21    9.17    0.00   87.92

Device:         rrqm/s   wrqm/s     r/s     w/s   rsec/s   wsec/s avgrq-sz avgqu-sz   await r_await w_await  svctm  %util
sda               0.00    55.50    7.00   44.00    92.00   488.00    11.37   110.52  929.20  139.86 1054     0.75    89.54
sdb               0.00    65.00    0.50   34.00     4.00   792.00    23.07     0.83   24.09    1.00   24     0.55    93.61
dm-0              0.00     0.00    0.00    0.00     0.00     0.00     0.00     0.00    0.00    0.00    0     0.14    99.99
dm-1              0.00     0.00    0.00    0.00     0.00     0.00     0.00     0.00    0.00    0.00    0     0.36    78.98
dm-2              0.00     0.00    7.00  242.50    84.00  1940.00     8.11   179.44  240.22  137.36  243     0.75    25.30
dm-3              0.00     0.00    0.00    5.00     0.00    40.00     8.00     1.30  305.90    0.00  305     0.23    45.12

04/05/2021 09:23:52 PM
avg-cpu:  %user   %nice %system %iowait  %steal   %idle
           9.50    0.00    11.21    19.30    0.00   92.92

Device:         rrqm/s   wrqm/s     r/s     w/s   rsec/s   wsec/s avgrq-sz avgqu-sz   await r_await w_await  svctm  %util
sda               0.16   114.34    7.02  191.18   132.04  2444.27    13.00     3.60   18.18   81.41   15     0.14    99.99
sdb               0.03   205.87    2.36   70.03    31.22  2207.55    30.92     5.81   80.25   53.76   81     0.94    97.54
dm-0              0.00     0.00    0.10    1.01    11.77     8.07    17.90     0.84  755.10   72.31  822     0.60    98.36
dm-1              0.00     0.00    0.09    0.13     0.74     1.03     8.00     0.22  985.66  153.25 1580     0.47    94.48
dm-2              0.00     0.00    9.25  575.59   129.18  4604.83     8.09     6.09    9.74   74.24    8     0.61    82.37
dm-3              0.00     0.00    0.12    4.74    21.57    37.89    12.24     2.52  518.00  131.58  527     0.23    93.15

[root@opmantek ~]#
|
This problem was solved with moving the MV to an environment with solid state disks, the client validated that the MV was using mechanical disks (HDD), so a clone of a laboratory MV does not work since it is presented the same Problem, when replacing HDD disks to solid state disks, the MV and the monitoring services stabilize, the RAM memory, CPU and disk utilization is normal, this according to the nodes that the monitoring system is monitoring .