Enhancing Network Visualization with Metric Links in opCharts
The Metric Links feature on opCharts provides highly enhanced visualization capabilities in topological, geographical, or network maps. It enables you to establish a custom metric defining link weight and colour. A common use-case for this could be defining the Signal-to-Noise Ratio (SNR) for a radio link between two distinct towers; see an illustration below.

Metric Links function similarly to Interface Links, with the exception that Metric Links allow the usage of any resource with a threshold to calculate the metric, instead of only the interface data.
Metric Links utilize the NMIS status system to derive their values, providing flexibility in defining what constitutes a good link (as opposed to a bad link). For detailed guidance on how to set this up, refer to the guide on Creating Thresholds with NMIS Modelling.
Metric Links are compatible with all map types.
The Metric Links feature is compatible with opCharts 4.5.9 and above.
Adding a Metric Link
To add a Metric Link -
- From the opCharts menu bar, choose Views > Maps.
- Click the Add
 icon on the top left corner to open the New Map page.
 - Click the Add Metric Link button under Components in the left pane.

- On the Add Metric Link window that opens, select the required Link Source and the Node.

- You can see the Resources (inventory) appear for the Node selected. Choose the one you require from the drop-down list.
- Select the Index for the chosen Resource.
- If a threshold exists for the Node, Resource, and the Index chosen, you can see the same in the Status field.
- Select a Link Destination and specify a Link Name.
- Click Add Metric Link to complete the Link creation.
The link between the two nodes will now utilize the status document's level to display the overall status, colouring the link accordingly. The link's line weight will be calculated based on the value.
Line Weight
| Level Range | Weight |
|---|---|
| Level < 5 | 2 |
| 5 <= Level < 10 | 3 |
| 10 <= Level < 20 | 4 |
| 20 <= Level < 40 | 5 |
| 40 <= Level < 60 | 6 |
| 60 <= Level < 80 | 8 |
| 80 <= Level | 10 |
Line Colour
| Status | Colour Code | Appearance |
|---|---|---|
| "reachable", "normal", "up" | #5cb85c | green |
| "degraded", "error", "minor", "warning" | #FFD700 | yellow |
| "unreachable", "major", "critical", "fatal", "down" | #d9534f | red |
| Others / Null | #999 | black |
Metric Link Resource Views
The Metric Links feature also enables you to configure custom resource panels - complete with tables and charts.
To set up these panels, you need to create a file opCharts_panels-all.json at conf/table_schemas/ ; see an illustration below.
You can use the file omk/lib/json/opCharts/table_schemas/opCharts_panels-all.json as a template.
The JSON file is an array of objects with each object containing three top-level keys:
| Key | Description |
|---|---|
| id | The resource name or inventory name. |
| table | An array of objects constituting the cells of the table. For more information on customizing the table schema, please refer to the documentation. |
| charts | An array of objects that generate radial charts at the bottom of the panel. |
[
    {
        "id": "ospfNbr",
        "table": [
            {
                "label": "Node",
                "name": "nodes.name",
                "cell": "Tooltip",
                "formatter": "ShortenedString",
                "editable": "false",
                "maxLength": 22
            },
            {
                "label": "ospfNbrIpAddr",
                "name": "inventory.data.ospfNbrIpAddr",
                "cell": "Tooltip",
                "formatter": "ShortenedString",
                "editable": "false",
                "maxLength": 22
            },
            {
                "label": "ospfNbrRtrId",
                "name": "inventory.data.ospfNbrRtrId",
                "cell": "Tooltip",
                "formatter": "ShortenedString",
                "editable": "false",
                "maxLength": 22
            },
            {
                "label": "ospfNbrState",
                "name": "inventory.data.ospfNbrState",
                "cell": "Tooltip",
                "formatter": "ShortenedString",
                "editable": "false",
                "maxLength": 22
            }
        ],
        "charts": [
            {
                "name": "inventory.data.ospfNbrEvents",
                "max": 100,
                "label": "ospfNbrEvents",
                "levels": [
                    "red",     75,
                    "orange",  50,
                    "yellow",  25,
                    "green",    0
                ]
            }
        ]
    },
    {
        "id": "pkts_hc",
        "table": [
            {
                "label": "Node",
                "name": "nodes.name",
                "cell": "Tooltip",
                "formatter": "ShortenedString",
                "editable": "false",
                "maxLength": 22
            },
            {
                "label": "Hardware",
                "name": "inventory.data.Hardware",
                "cell": "Tooltip",
                "formatter": "ShortenedString",
                "editable": "false",
                "maxLength": 22
            },
            {
                "label": "IP",
                "name": "inventory.data.ipAdEntAddr1",
                "cell": "Tooltip",
                "formatter": "ShortenedString",
                "editable": "false",
                "maxLength": 22
            }
        ],
        "charts": [
            {
                "name": "latest_data.subconcepts.pkts_hc.derived_data.ifOutUcastPkts",
                "max": 100,
                "label": "outUcastPkts",
                "levels": [
                    "red",     75,
                    "orange",  50,
                    "yellow",  25,
                    "green",    0
                ]
            },
            {
                "name": "latest_data.subconcepts.pkts_hc.derived_data.ifInUcastPkts",
                "max": 100,
                "label": "inUcastPkts",
                "levels": [
                    "red",     75,
                    "orange",  50,
                    "yellow",  25,
                    "green",    0
                ]
            }
        ]
    }
]
Known Issues
Issue: Error - No schema found
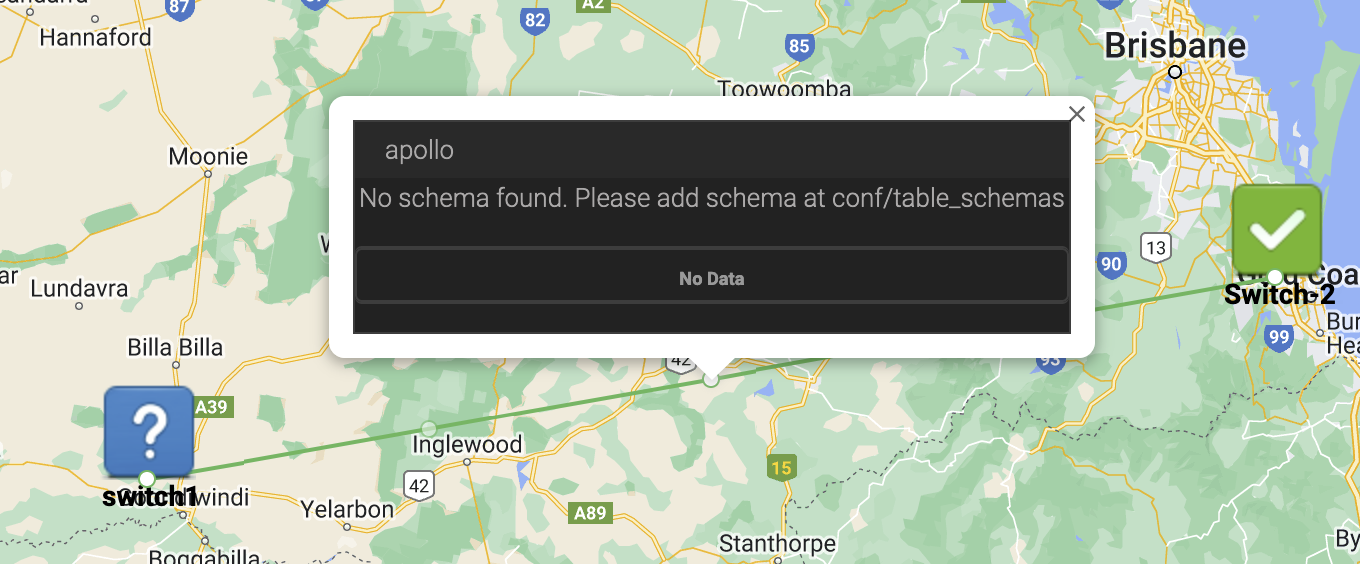
Resolution: This may occur if a Resource does not have an existing table schema. These will be auto-generated in future updates.