As at Open-AudIT 2.2, we now ship with several pre-configured Dashboards. If you are a Professional user, you can select between two of these and set it as your default page when you logon. If you are an Enterprise user, you can not only select between the five preconfigured Dashboards, but you also have the ability to create your own.
The page How do Dashboards and Widgets work? may be of some assistance here.
Dashboards use Widgets, of which we supply over thirty as a default set. Professional users cannot alter these, but an Enterprise user has complete customisation abilities - including creating your own.
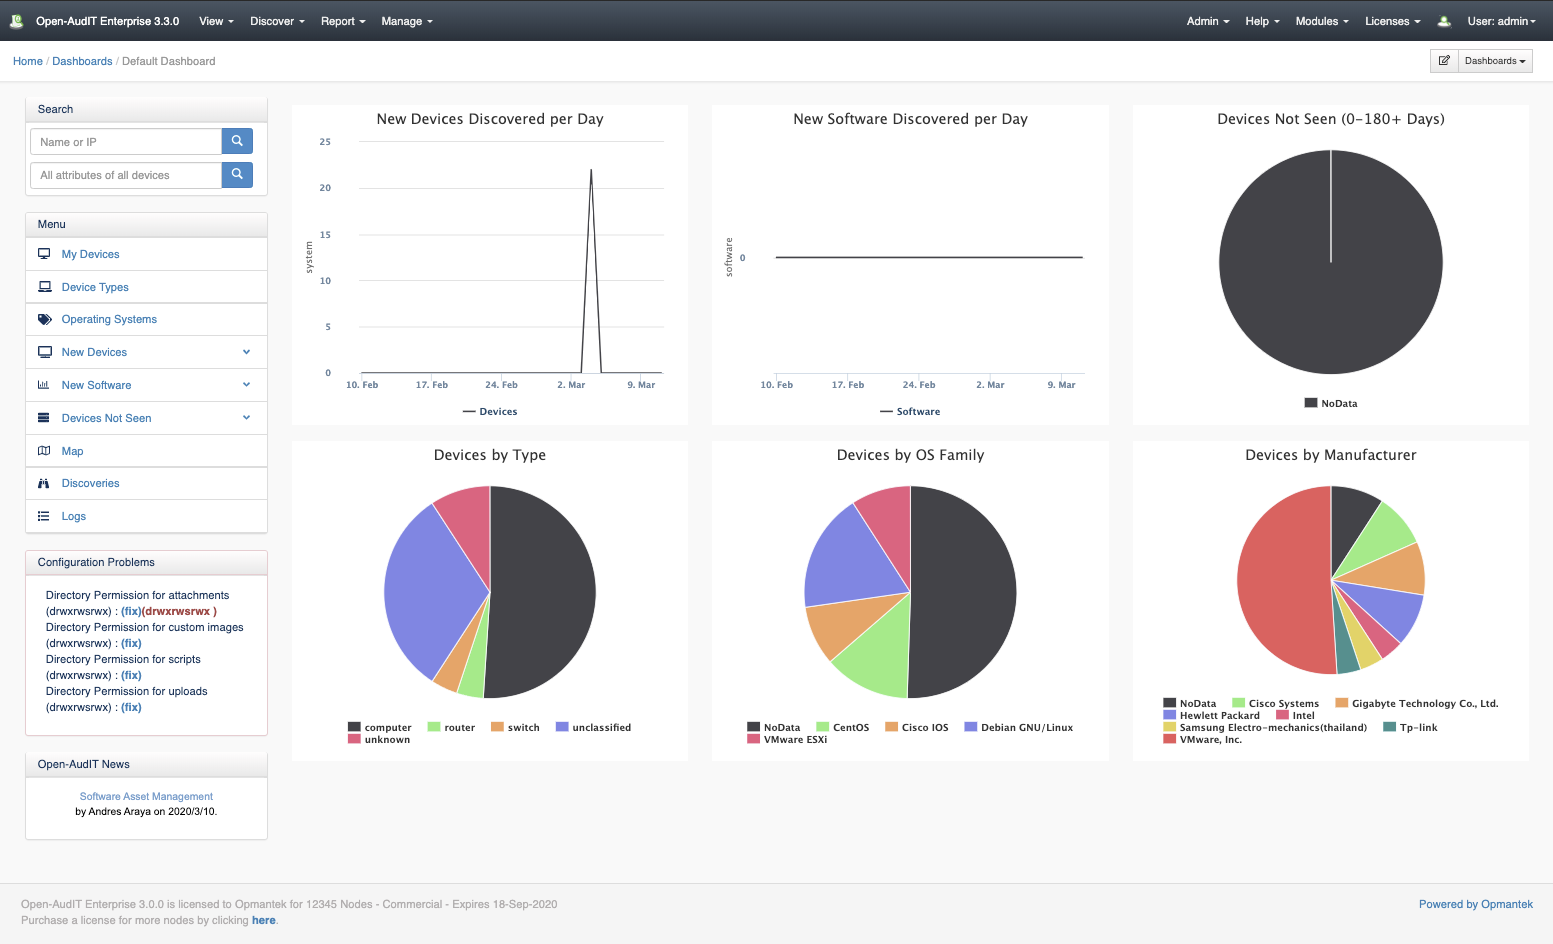
Dashboard provide "at a glance" Open-AudIT provides a dashboard that provides important visibility for changes occurring on your network as well as providing quick links to device types, manufacturers, and operating systems and so much more.
Quickly view the status of devices appearing your network. Easily see which type of devices, device manufacturers and operating systems are on your network. Links from the charts provide extensive data and data over time reporting.

Database Schema
The database schema can be found in the application is the user has database::read permission by going to menu: Admin -> Database -> List Tables, then clicking on the details button for the table.
API / Web Access
You can access the collection using the normal Open-AudIT JSON based API. Just like any other collection. Please see The Open-AudIT API documentation for further details.
Default Items
Shipped are a set of default items. These can be found by going to menu: Help → Defaults → Dashboards.