| Excerpt |
|---|
 Image Added What Image Added What
|
...
is NMIS?NMIS (acronym for Network Management Information System) is an open-source network management system that was first released in 1998. Originally written by Keith Sinclair and with later substantial input from Eric Greenwood, the intellectual property for NMIS was purchased by commercial open source software company Opmantek in early 2011 under a stated commitment to keep "NMIS free and lead the community to rapidly advance the product". NMISv8 was released by Opmantek shortly after and remains free and open source. NMISv9 is currently (as at April, 2020) in the final stages of development. NMIS is a complete network management system which assists with fault, performance and configuration management, providing performance graphs and threshold alerting as well as highly granular notification policies with many types of notification methods. Additional modules and support provided by Opmantek are available to extend the capabilities of NMIS. |
...
excerptWhat does NMIS do?NMIS monitors the status and performance of an organization's IT environment, assists in rectification and identification of faults and provides valuable information for IT departments to plan expenditure and IT changes.
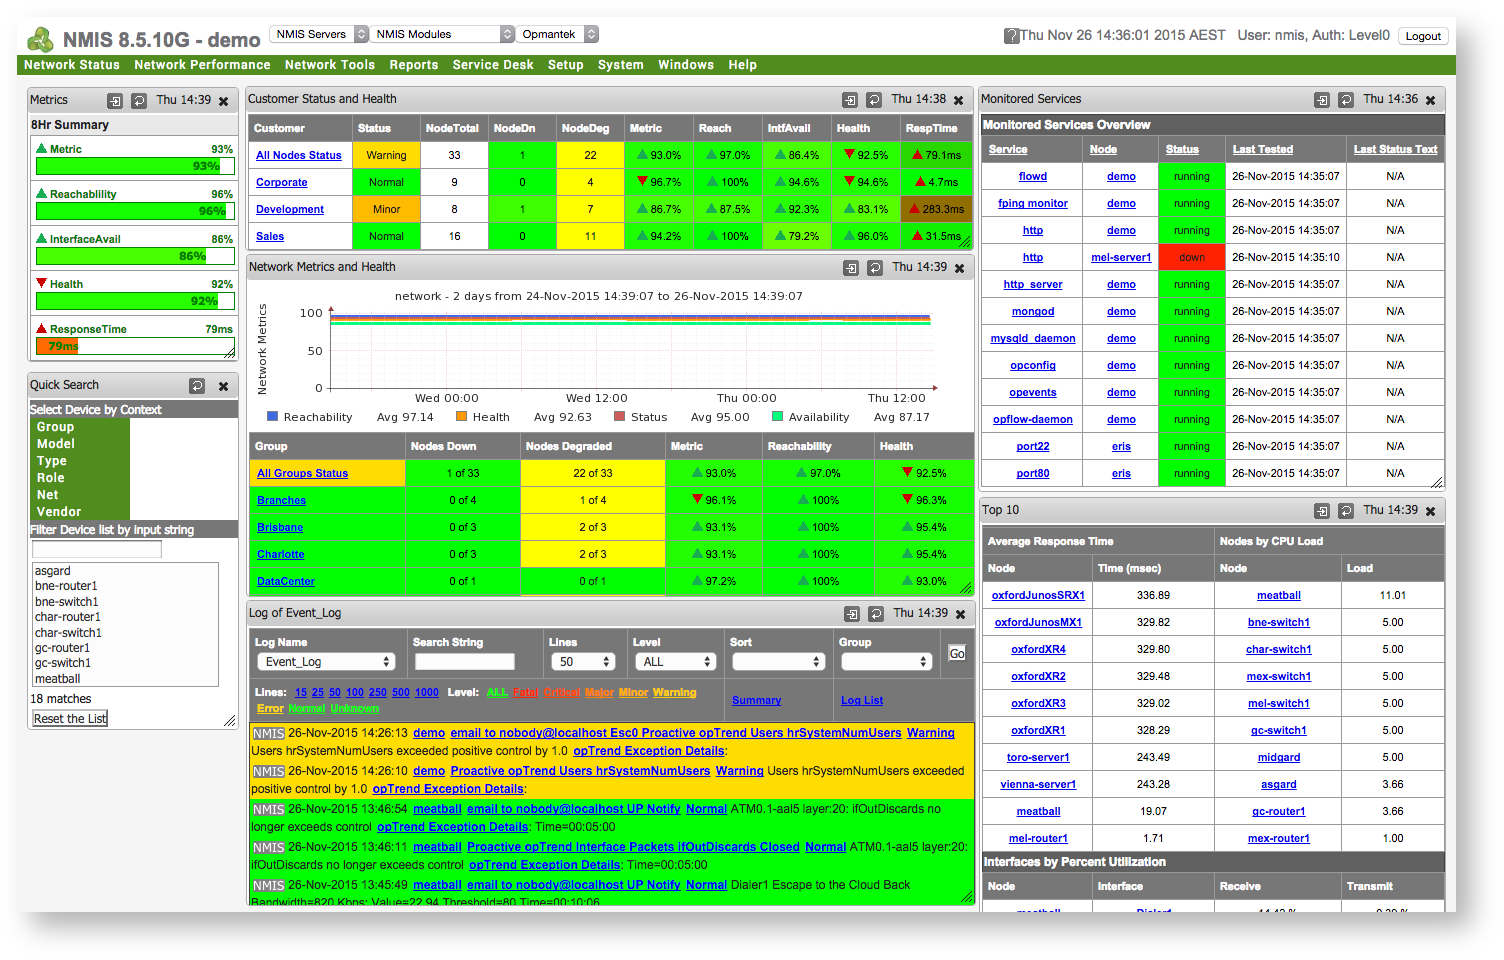 Image Added Image Added
|
But Why?
NMIS performs multiple network management functions from the OSI Model and International Organization for Standardization FCAPS model, these being - Fault, Configuration, Accounting and/or Administration, and Performance. These metrics provide valuable capabilities and features for fault and performance management, which in turn are useful for many other aspects of network and business management. NMIS is very popular within Telecommunications carrier organizations and Managed Service Providers (MSP's) and is used by IT staff as a key business management and improvement tool.
...
How does it work?
NMIS uses a single poll (usually but not necessarily SNMP) for performance and fault data, which reduces the bandwidth of the network management traffic and increase the performance of the network management system. The returning data creates real-time performance monitoring and graphing. When NMIS probes are deployed throughout the network, the network can be managed easily to avoid bottlenecks and enable zero cost redundancy. Both the front and back ends of NMIS are highly extensible and features are easy to add. Custom statics can be gathered for any metric available on a device.
...
Licensed free of charge under the GNU General Public License. Support contracts provided by Opmantek.
Feature Summary
| Performance Management | Faults and Events | Configuration |
- Integrated Fault and Performance Management.
- Graphs can be produced on the fly.
- Graphing period is flexible, graphs can have varying lengths – up to 1 year.
- Interactive graphs with drill-down.
- Graphing of Interface, CPU, Memory stats.
- Interface statistics are returned in utilisation and/or bits per second.
- Response time graphed and metrics for health and availability generated from statistics collected.
- Threshold engine which send alerts when thresholds are exceeded.
| - Integrated Fault and Performance Management.
- Sophisticated business rules engine (see heading for Business Rules Engine)
- Varying event levels for different device types.
- Color coded events, status for at a glance interpretation.
- Integrated alerting subsystem
- Event levels are set according to how important the device is to the organizations (see Business Rules Engine).
- Events are stateful including thresholds, meaning that an event is only issued once.
- Integrated logging facility to view NMIS events and syslog messages.
- Outage time calculated for each down event
- Planned outages can be put in so alerts are not issued.
| - Find function which searches interface information for node name, interface name, description, type, IP address, for matching interfaces.
- Interface information includes IP address information.
- Dynamic handling of ifIndex changes and difficult SNMP interface handling
- Checking of changes to device details.
- NMIS stores contacts and location information which links to the SNMP sysContact and sysLocation MIBS.
- Produces DNS and Host records from the collected IP addressing information
- Produces DNS LOC records for “visible” traceroute utilities.
- Inventory management –list managed devices by location or type and software revisions
|
| Real-time monitoring | Operational Tools | Management Reporting |
- Live base-lining
- Live performance monitoring
- Live availability monitoring
- Live flexible graphs
- Live flexible notification conditions
- Live alerting
| - Diagnostic tools such as ping and traceroute
- Produces DNS LOC records for “visible” traceroute utitlities.
- And many more
| - Powerful out of the box reporting.
- Reports to assist in planning and measurements against KPIs.
- Live Summary of entire managed environment into a single metric, which indicates reachability, availability, health and response time of all devices being managed.
- Summary pages of devices including device information, health graphs, and interface summaries
|
| Extensive list of supported devices | Business Rules Engine | Notification and Escalation |
- If it has an IP address, NMIS can manage it and it will leverage the key IP of NMIS.
- If it doesn’t have an IP address NMIS can probably manage it too!
- Support of SNMP v3 v2 and v1
- SNMP traps
| - Event levels are set according to how important the device is to the business.
- Planned outages – removing alerts during planned outage periods
- Policy Based Actions – business actions for people to follow when a fault occurs.
- Policy based Escalation
- Policy Based Event Handling
- Policy based notifications
| - Sophisticated business rules engine (see heading for Business Rules Engine)
- Escalation subsystem based on device groups which provides high granularity.
- Notification engine can handle any “command line” notification method, including email, paging, signs, speakers, etc.
- Integrated event manager, allowing a list of active events with an escalation level.
|
| Distributed Monitoring | Notification | Ease of Implementation |
- Manage an unlimited number of Nodes
- High level of redundancy
- Single configuration for the system
- Access all information from one place
- Straight forward setup
| - Powerful, out of the box reporting
- Reports for utilisation, outages and more
- Snapshot and dynamic reporting for metrics on all devices and groups of devices.
| - Centralised configuration and storage of information
- Very simple to implement – download the VM
|
| Scalability |
- Performance and Fault data in a single pole
- Extremely efficient monitoring platform
- UI desgined to provide specilized views to assist in “seeing the wood from the trees” in large environments.
- Summary information
- Simple, policy based escalation
|