...
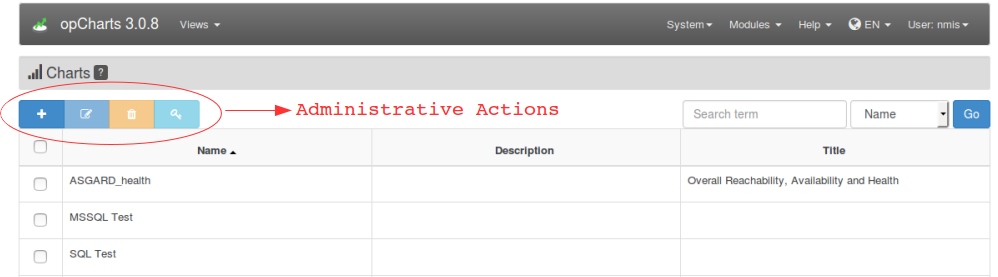
The resulting Charts page will look something like the following. From here via the administrative action palette we can add, edit, delete, and set permissions to charts.
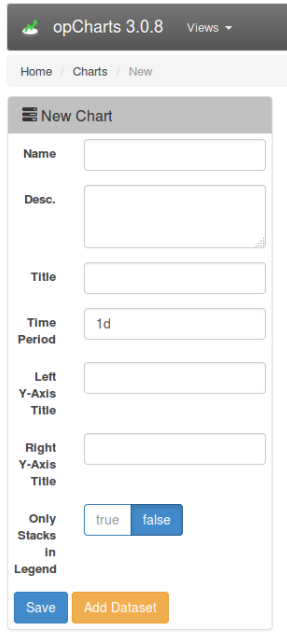
Click the blue '+' button to create a new chart and we will be presented with a page such as the following.
| Field Name | Function |
|---|---|
Name | |
| Desc. | |
| Title | |
| Time Period | |
| Left Y-Axis Title | |
| Right Y-Axis Title | |
| Only Stacks in Legend | No idea |
| Save | |
| Add Dataset |