Introduction
opCharts has the capability to create custom charts that may present any combination of data sets to the user in a single easy to read medium.
Creating a New Custom Chart
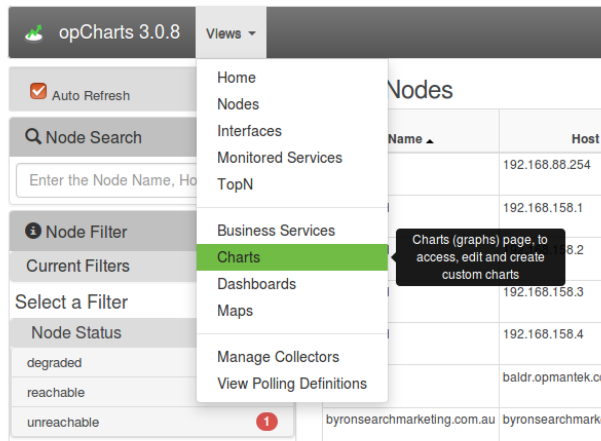
From the opCharts home page navigate to the charts view.
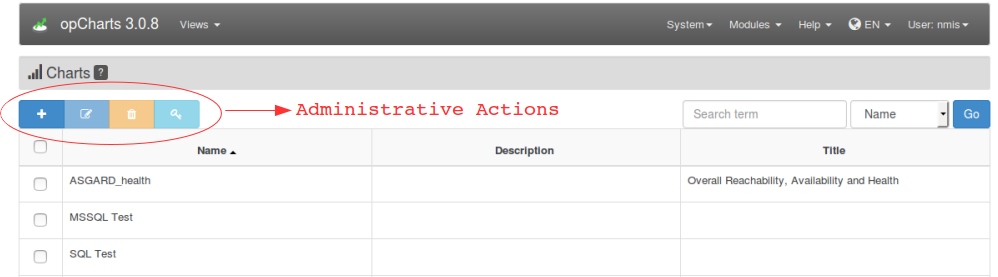
The resulting Charts page will look something like the following. From here via the administrative action palette we can add, edit, delete, and set permissions to charts.