Table of Contents
Dashboards
Index
View Node
Searching for a node can be done by using the name of the node, the ip address of the node or the group of the node. All strings are tokenised by "white space characters" and the search is done from the start of each token.
Charts
Component options:
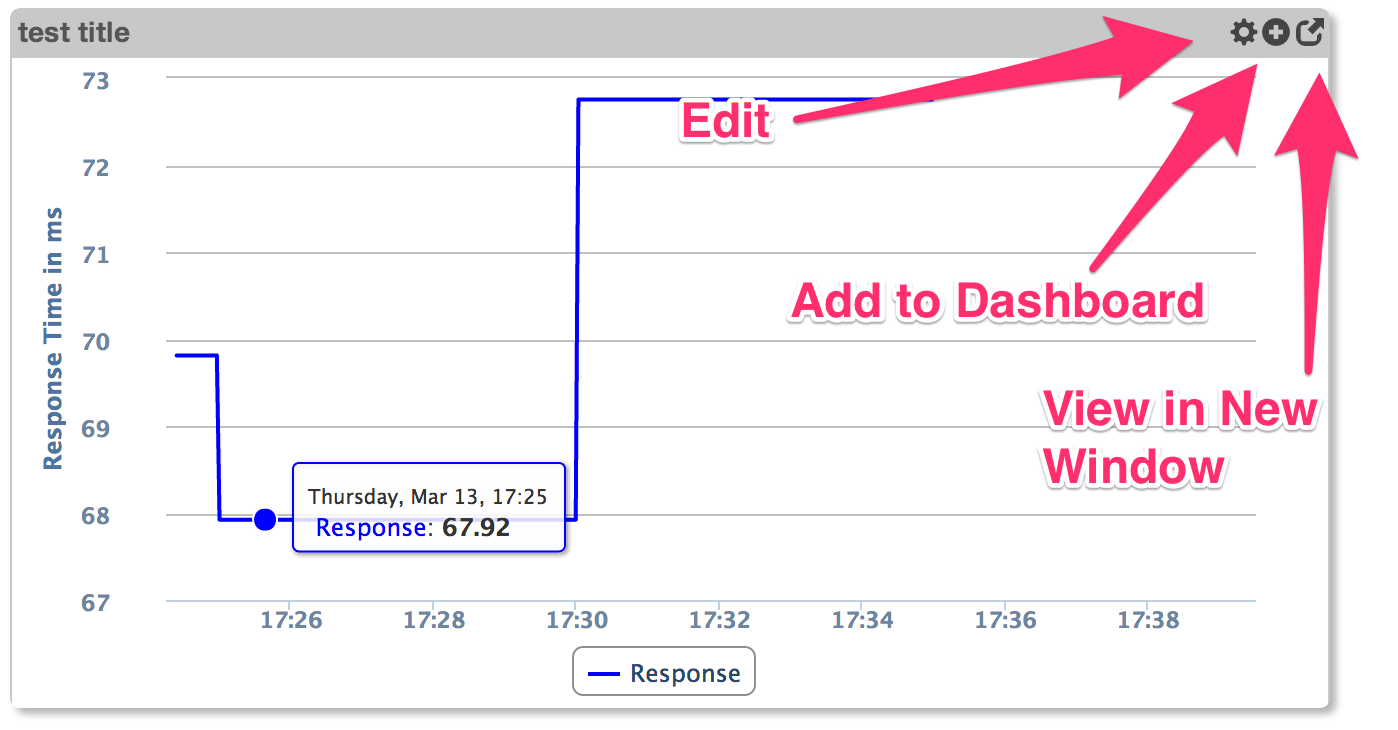
Edit:
This button will only exist when viewing a chart that has been saved. If this chart is auto-generated by opCharts then the button will not appear. If you want to save this chart the fastest way is to press the "+" sign, which will save the chart and open a new dashboard to save it into (you don't have to save the new dashboard, hit back and refresh and the edit button will appear)
Add to Dashboard:
Pressing this button presents a form with the option to select which dashboard to add the chart to, the option to name the chart (if the name already exists, whatever chart is using that name will be used, if a unique name is used the current chart will be saved under that name when Add is clicked). After add is clicked a the requested dashboard is displayed and the chart is placed in the first empty component found. If no empty components are found it will replace the last entry.
EDITORS NOTE: This function should be changed to just add a new component, this is a small hangover from the older dashboard template system.
View in New Window:
This button will open the chart in full-screen mode. This option is only present if the chart has been saved (just like edit).
Introduction
Opmantek's opCharts module is an industry leading custom dashboard tool designed specifically to enable users to generate targeted, custom single-pane of glass views into the network's performance - both current and over time. Drawing data from NMIS as well as 3rd party SQL databases, opCharts puts the power into the user's hands to build dynamic interfaces by combining Components into single or multilayer visual landscapes called Dashboards.
By abstracting data into Key Performance Metrics, and combining and sorting devices into dynamic groups through user-defined metadata, opCharts can easily support high-level abstracted user views at the 50,000 ft level while still allowing quick drill-down into detailed performance metrics for fast problem resolution.
Executive or technician - opCharts gives each user the power to easily organize and view their network's performance the way they want to see it.
Overview
opCharts supports five primary views: Nodes, Interfaces, Monitored Services, Dashboards, and TopN.
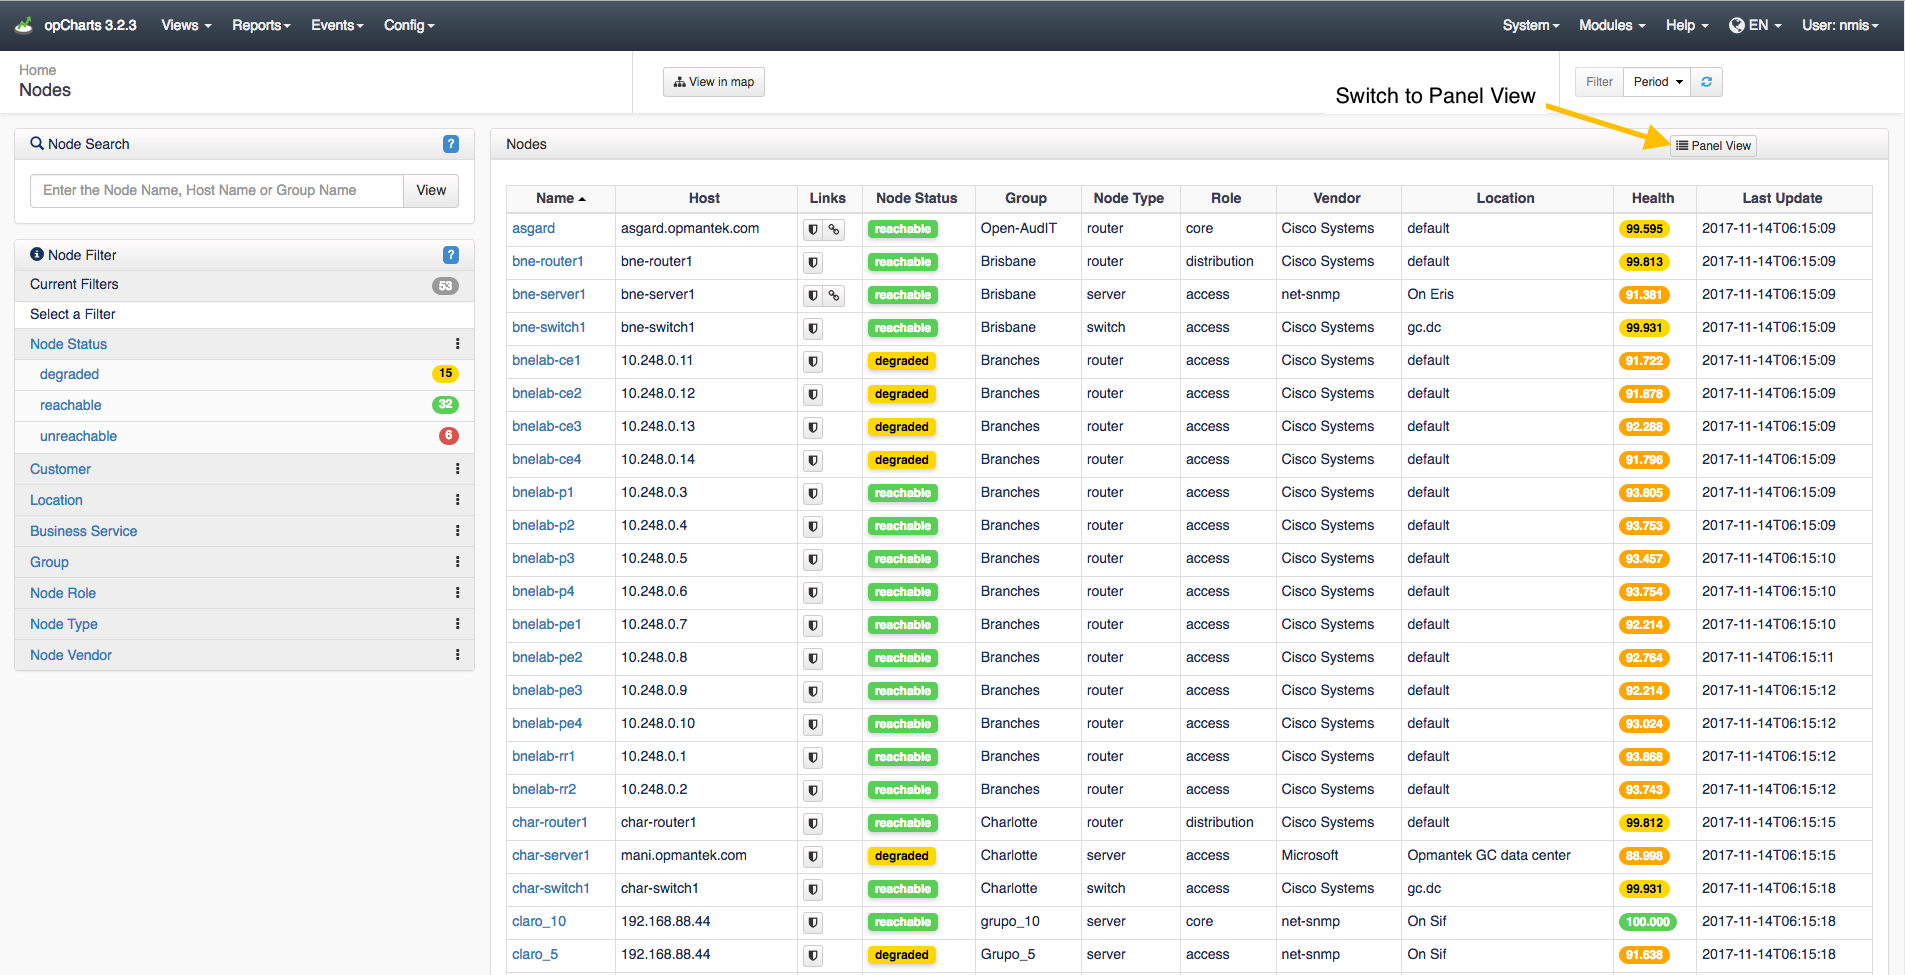
Nodes View
To open the Nodes View, select Views -> Nodes from the opCharts menu bar. By default, this displays a list of all nodes in your environment, but you can also select Panel View to abstract each nodes performance information into easy-to-understand panels. These panels include such information as the node name, node status, vendor, and key performance information regarding each node.
*Note* The Nodes view is the default view for opCharts unless a default Dashboard has been assigned to the user account.
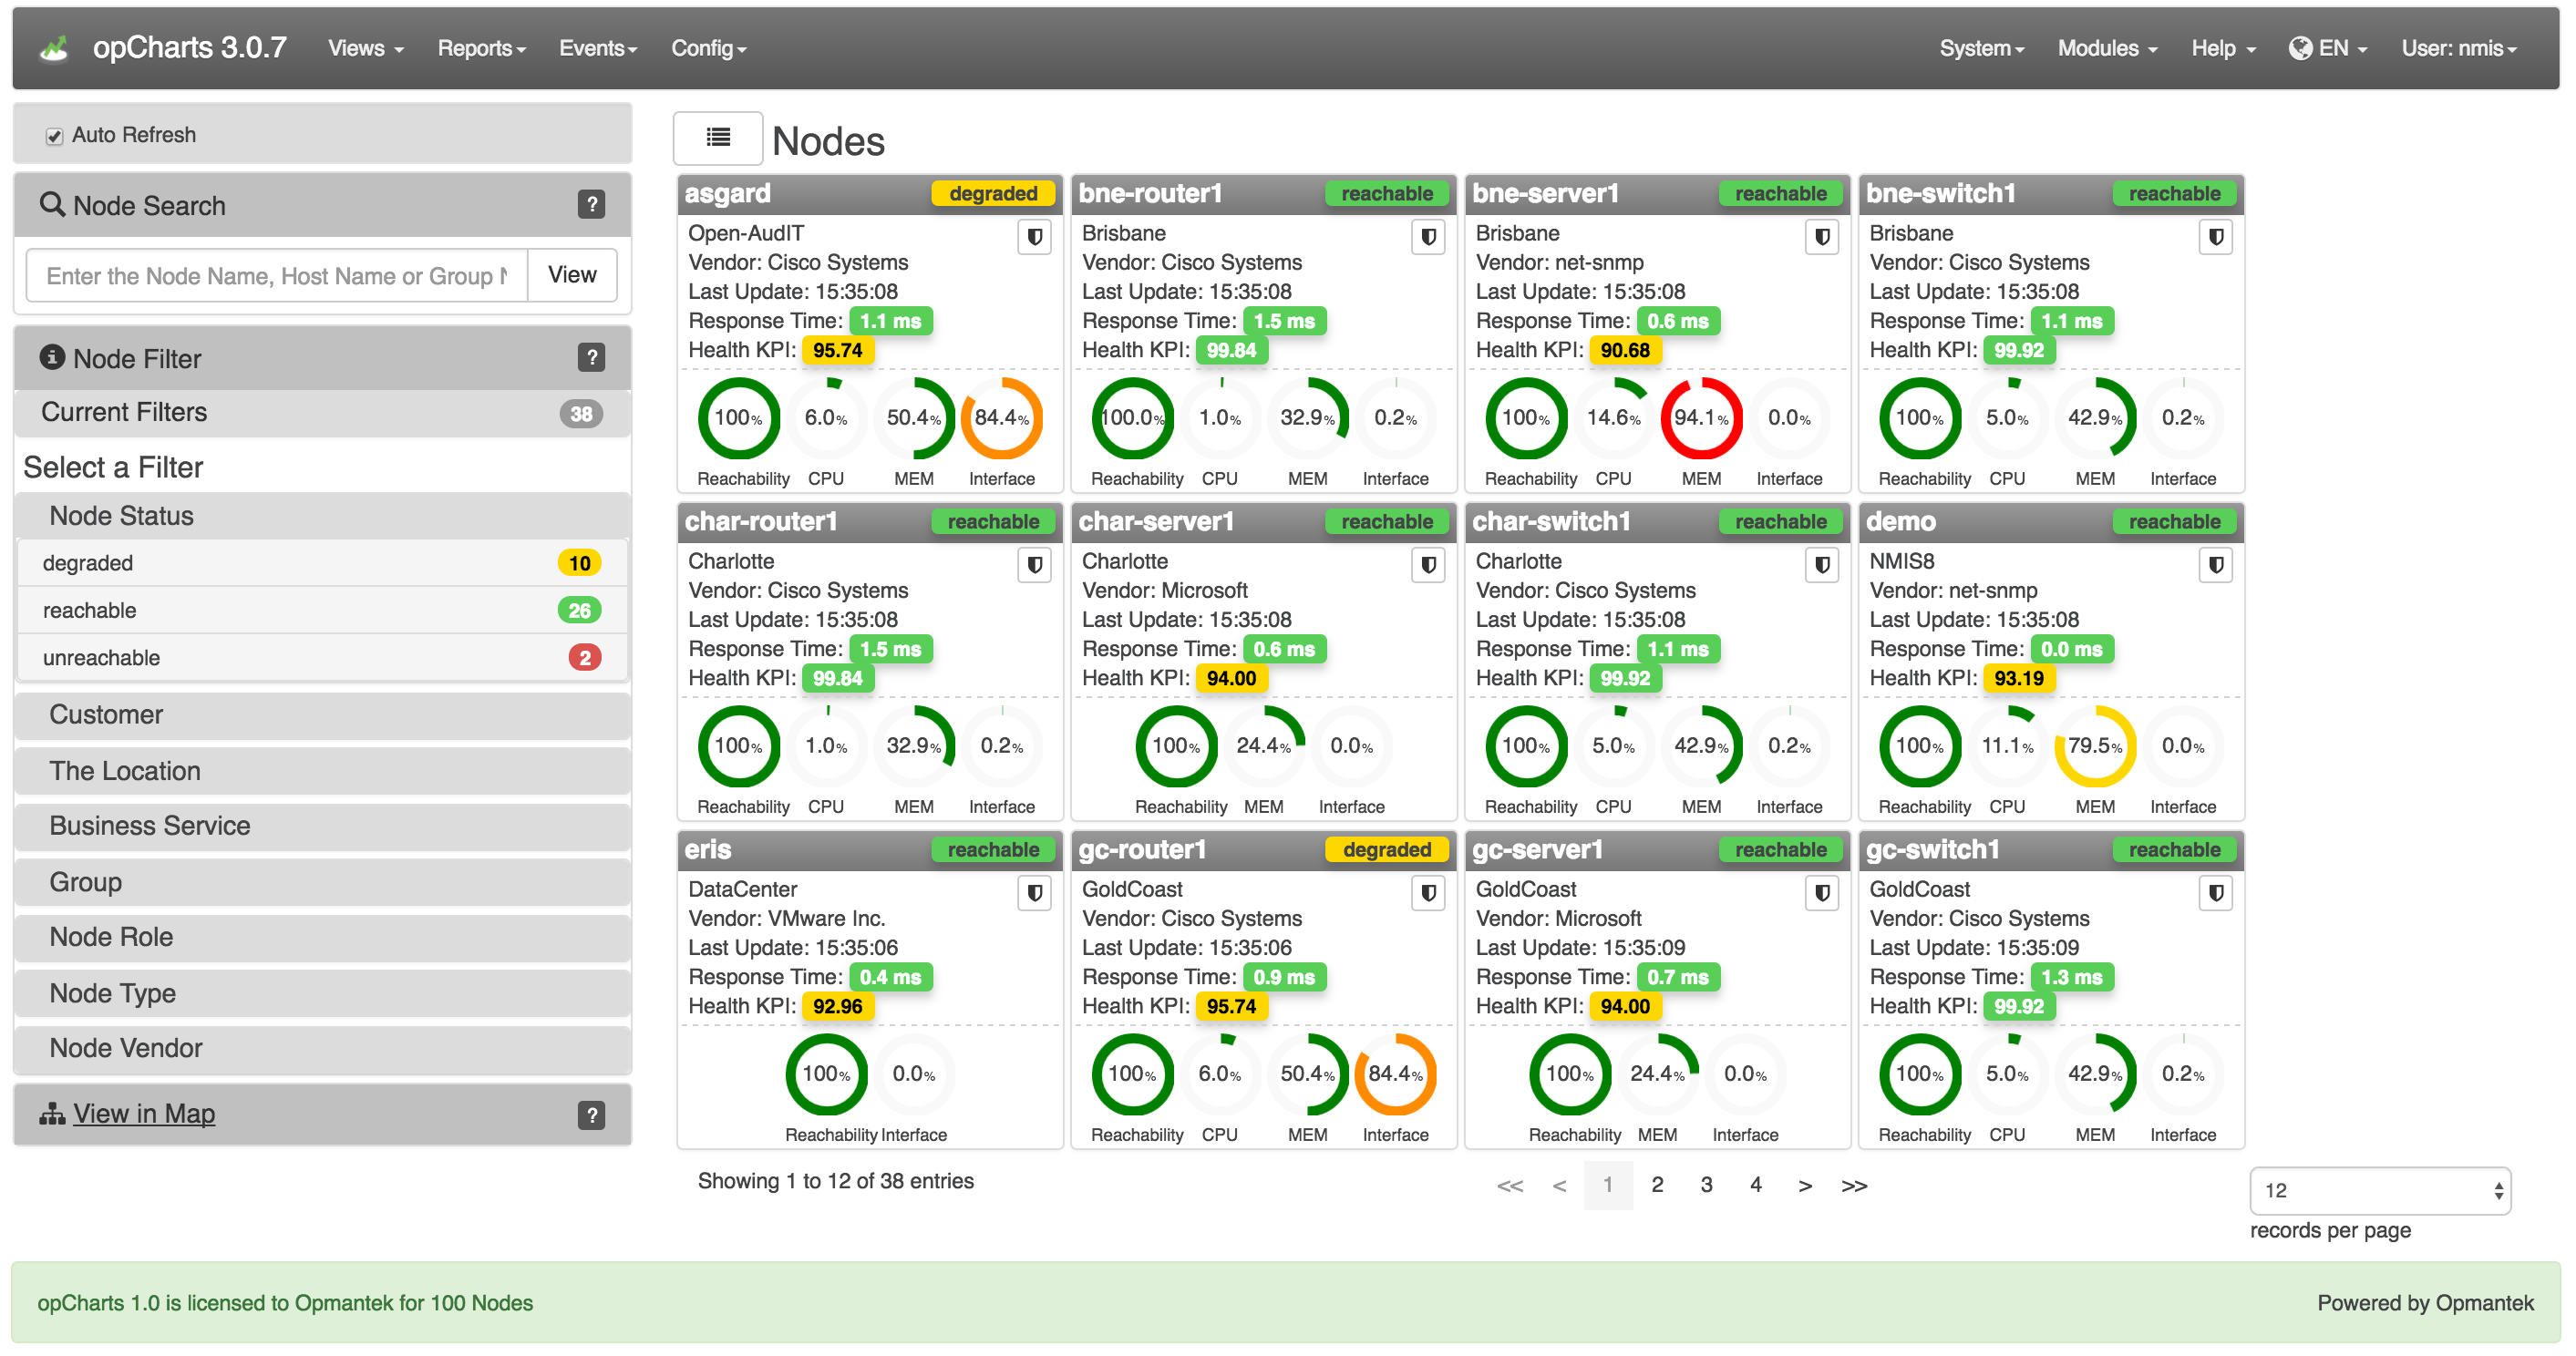
Panel view
In this view each node is represented by a panel versus a line in a table. Each panel provides important information for the represented node. Some of this information is conveyed via dials. There are two options to chose from in regard to how data is displayed in the 'node panel dials'. Please refer to the administration guide in order to switch between the two panel dial options.
Node Panel Dial Display Options:
- KPI based
- Resource based
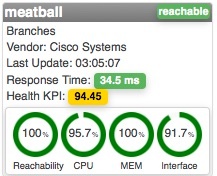
KPI based
In this mode the dials represent the health of the KPI being measured, higher ratings are more desirable. In the example below with the CPU at 4.3% utilization the KPI score is 95.7%; a desirable condition. If a KPI value is below the desired standard the dial will turn red.
Resource based
In this mode the dial represents the amount of resource consumption. In the example below the CPU utilization for asgard is at 6%; a desirable and the dial is green. The memory usage of bne-server1 is at 94.1%; an undesirable condition and the dial is red.
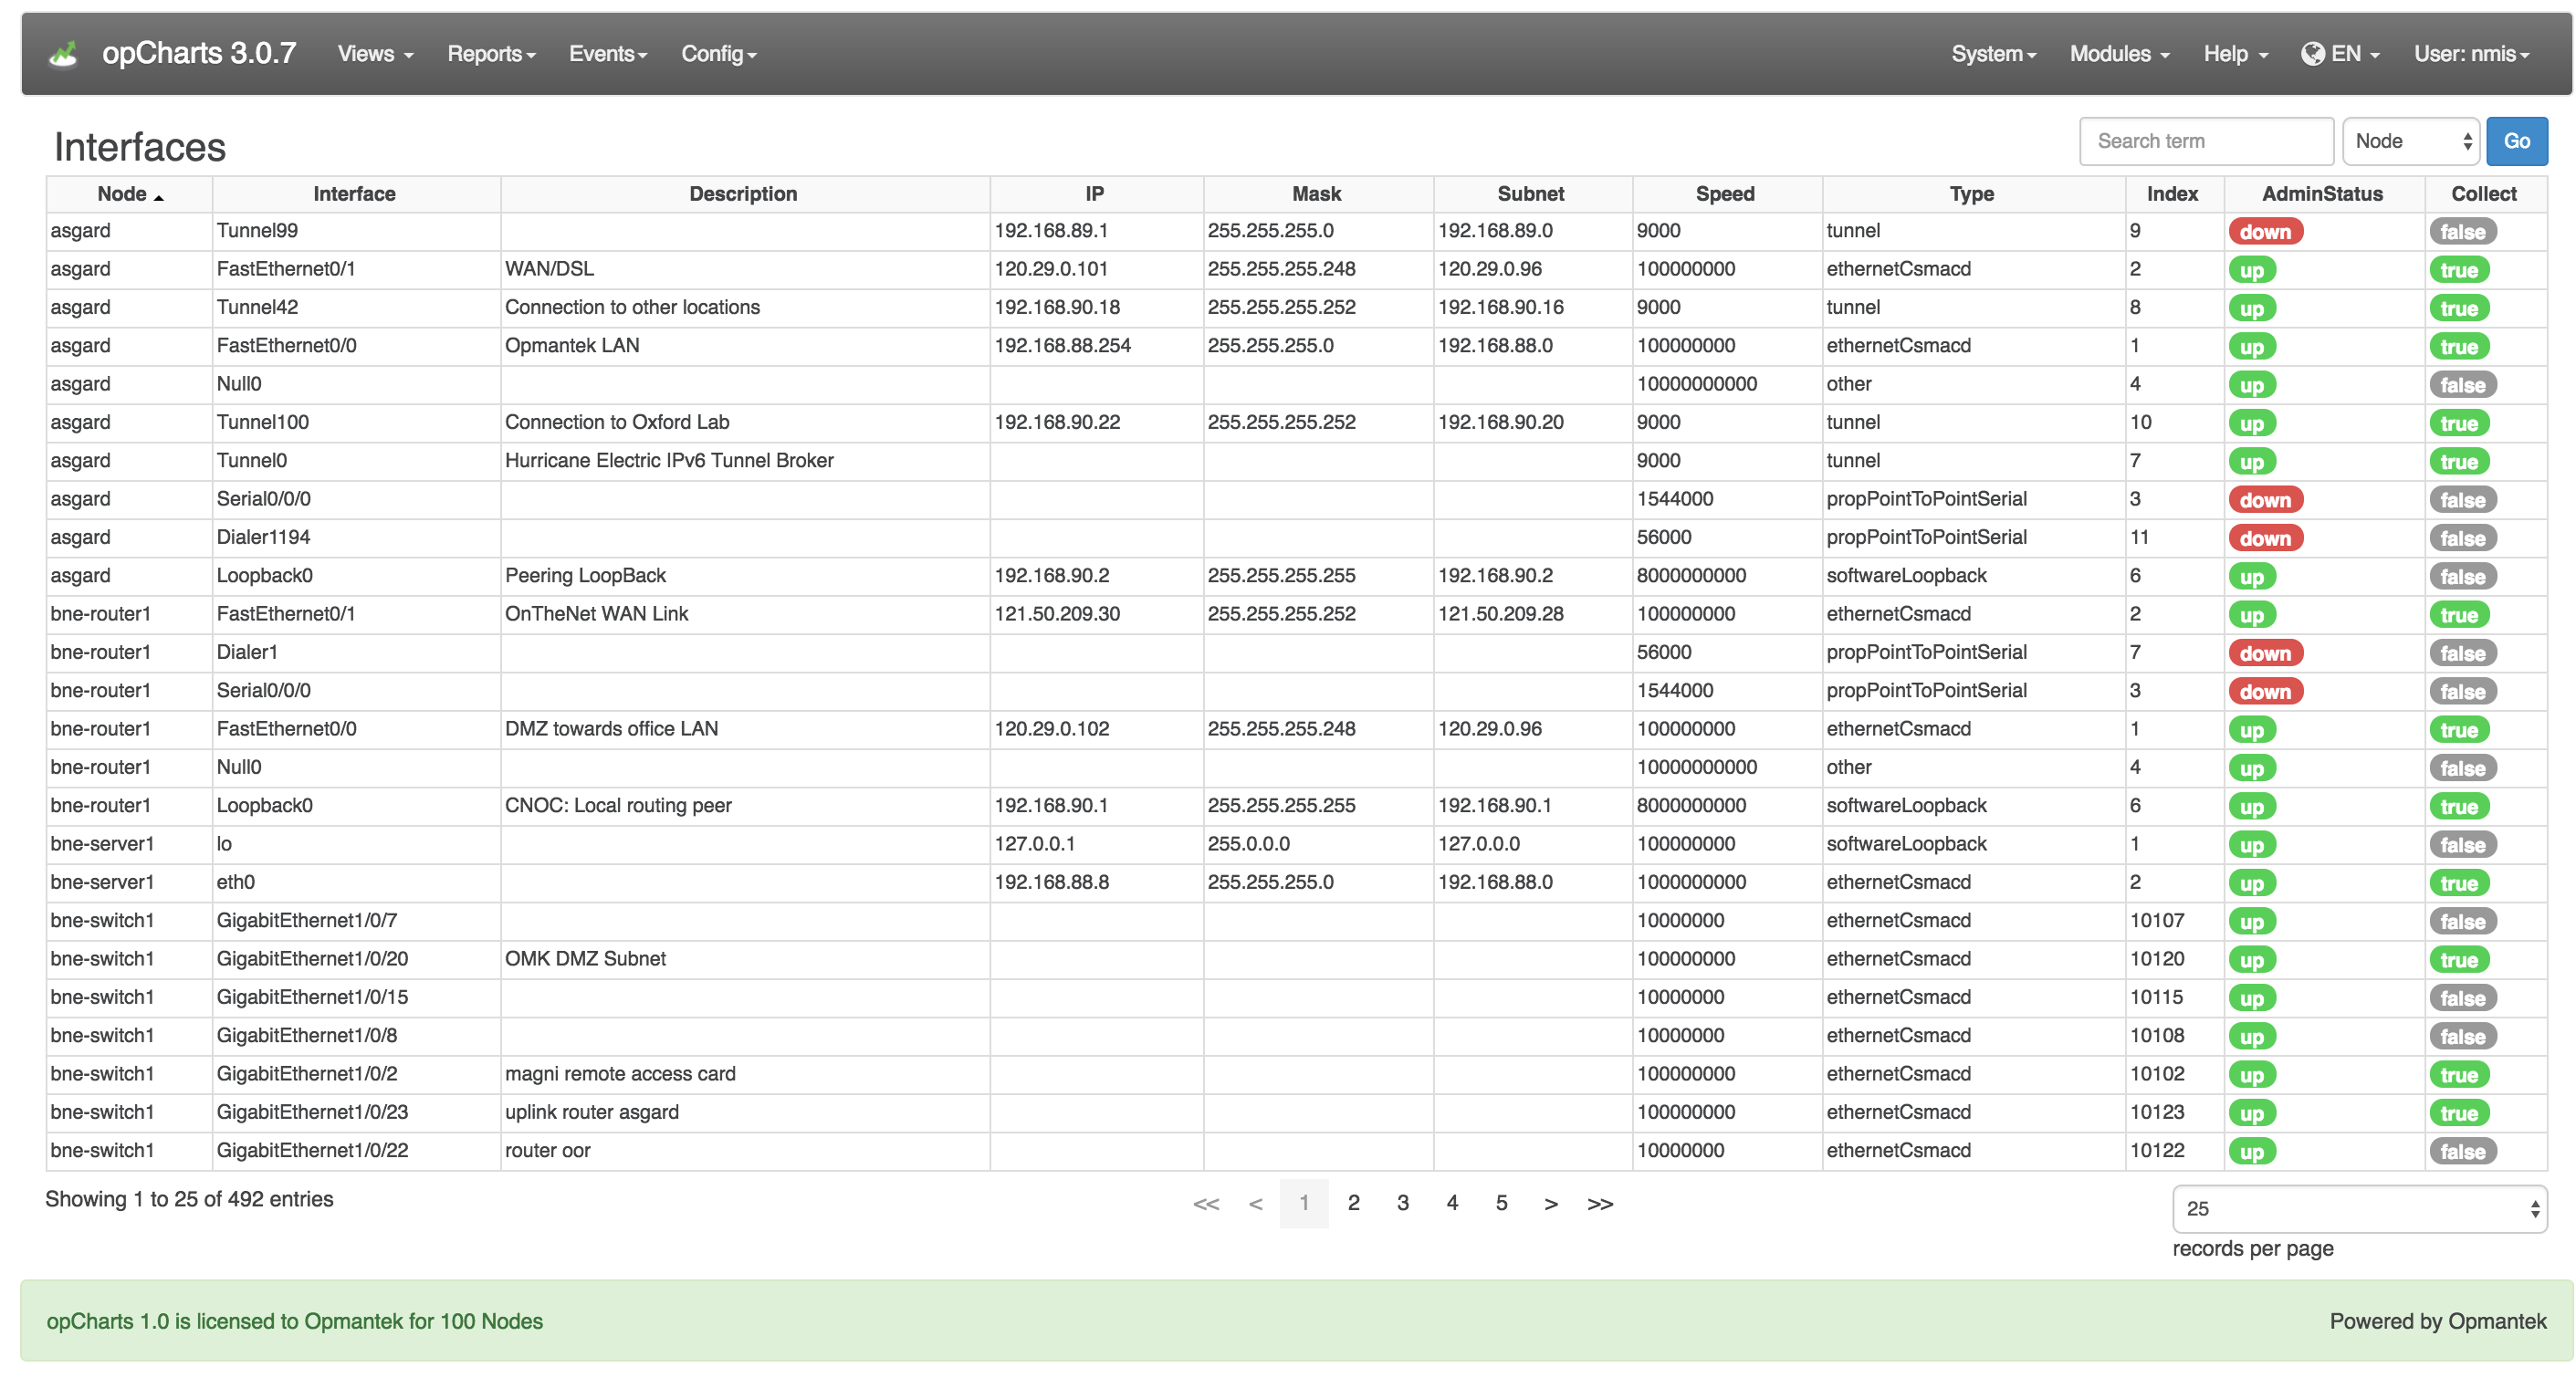
Interfaces View
To open the Interfaces View, select Views -> Interfaces from the opCharts menu bar (Views → Inventory in opCharts 4). This view provides an easy-to-search list of all interfaces in your environment. From here, the user can drill down into the details of individual nodes and interfaces.
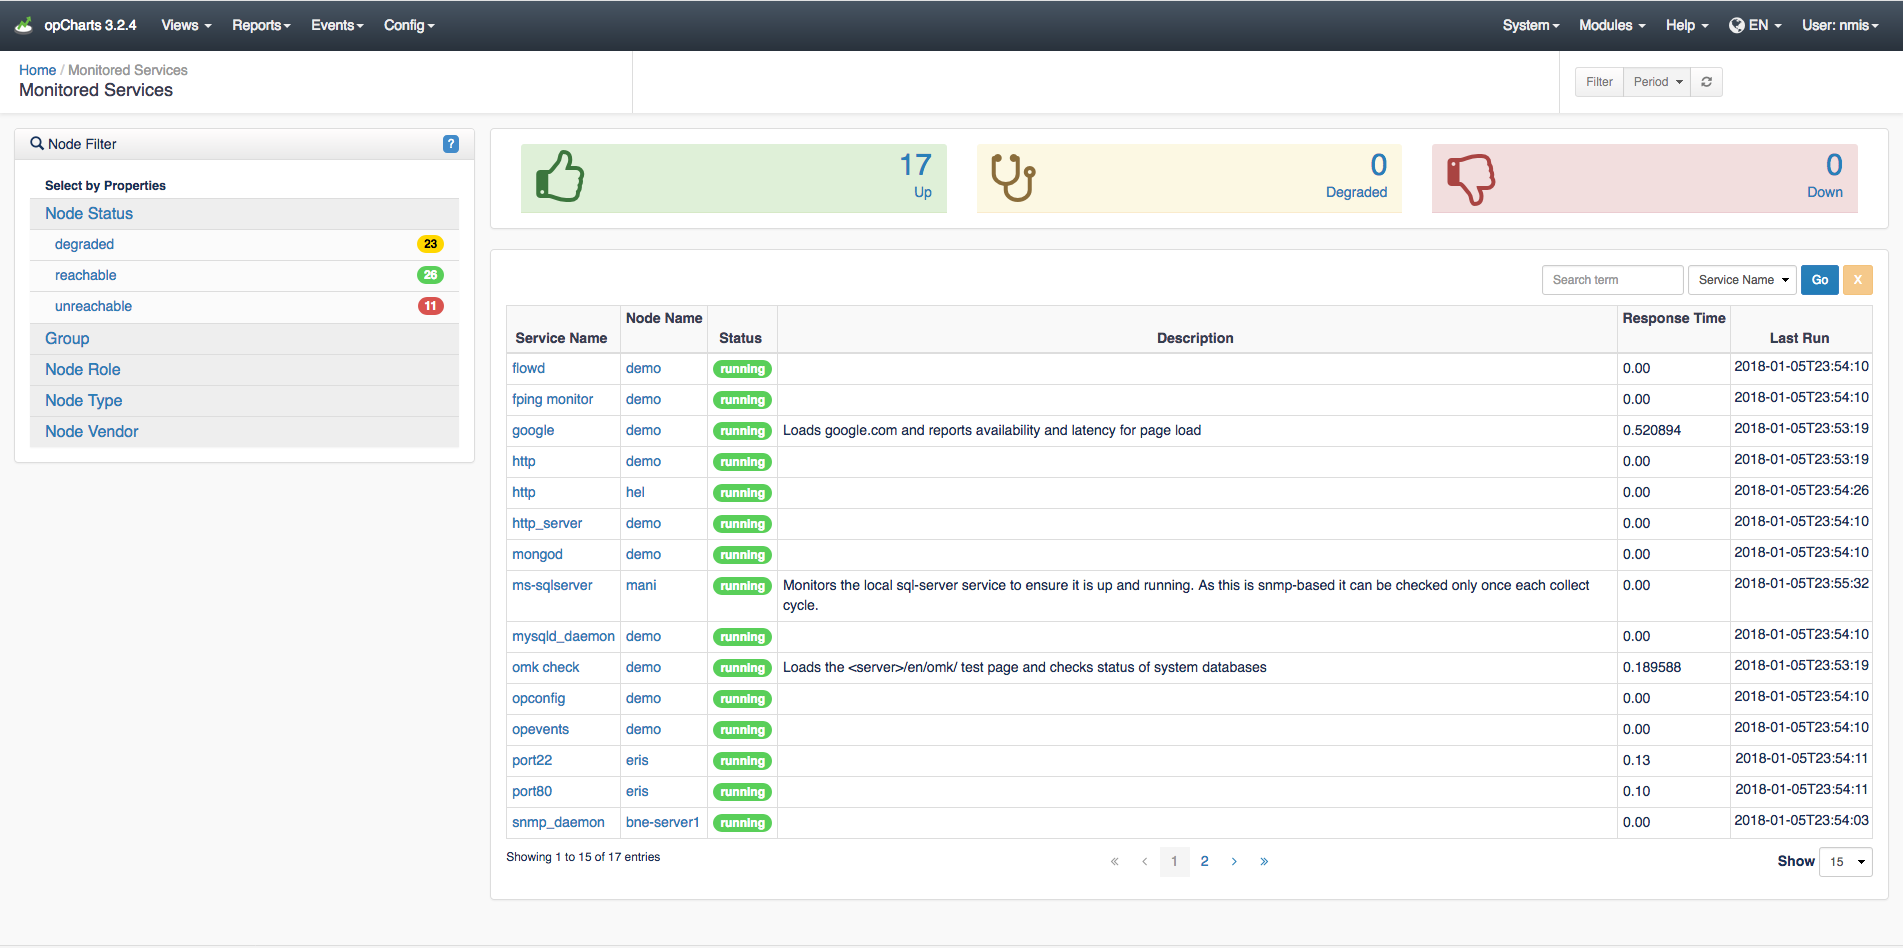
Monitored Services View
To open the Monitored Services View, select Views -> Monitored Services from the opCharts menu bar. Services can be filtered by groups such as node status and group and as of opCharts 3.2.2 you can do a search of the monitored services list.
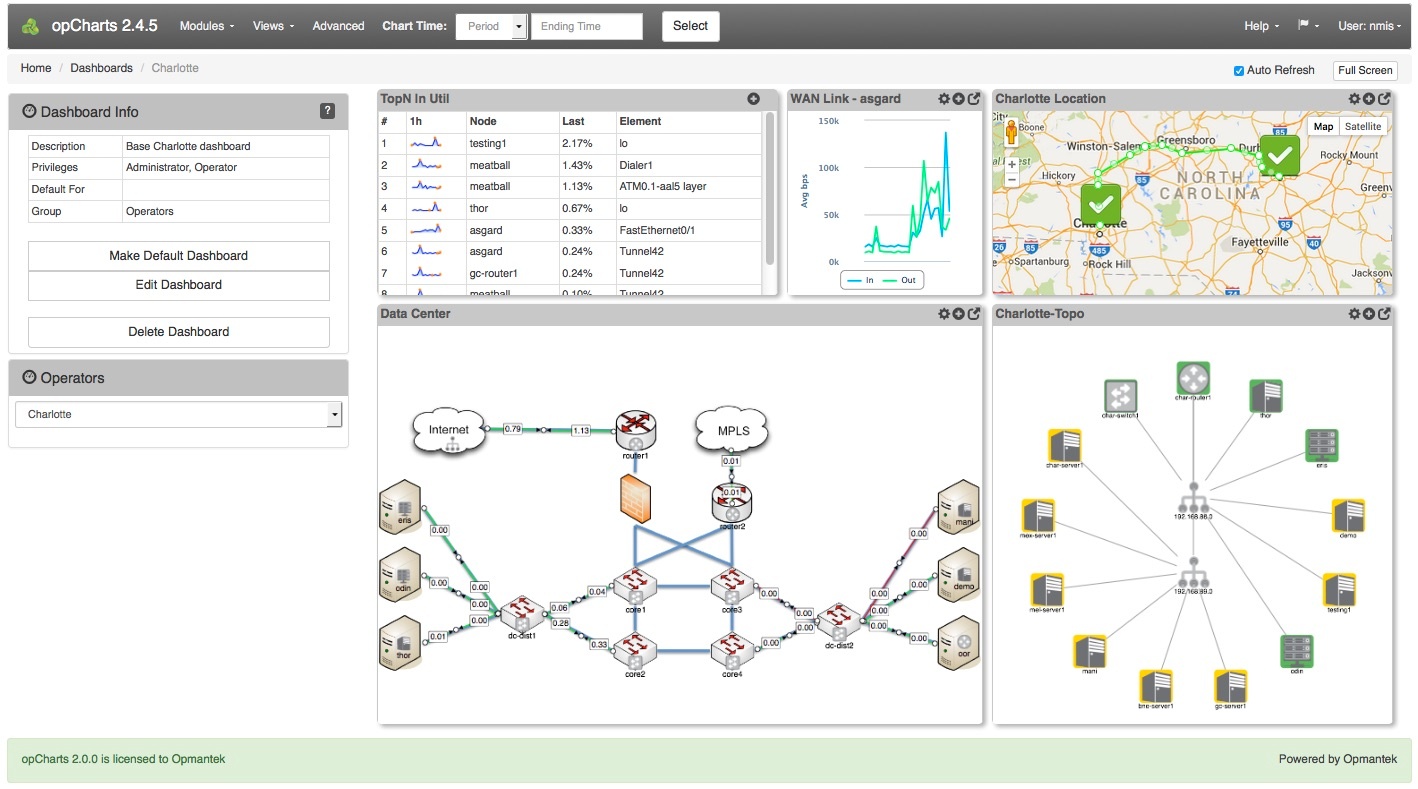
Dashboards View
To list all available Dashboards, select Views -> Dashboards from the opCharts menu bar. From there, the user can select to create a New Dashboard, and View/Edit/Delete an existing Dashboard.
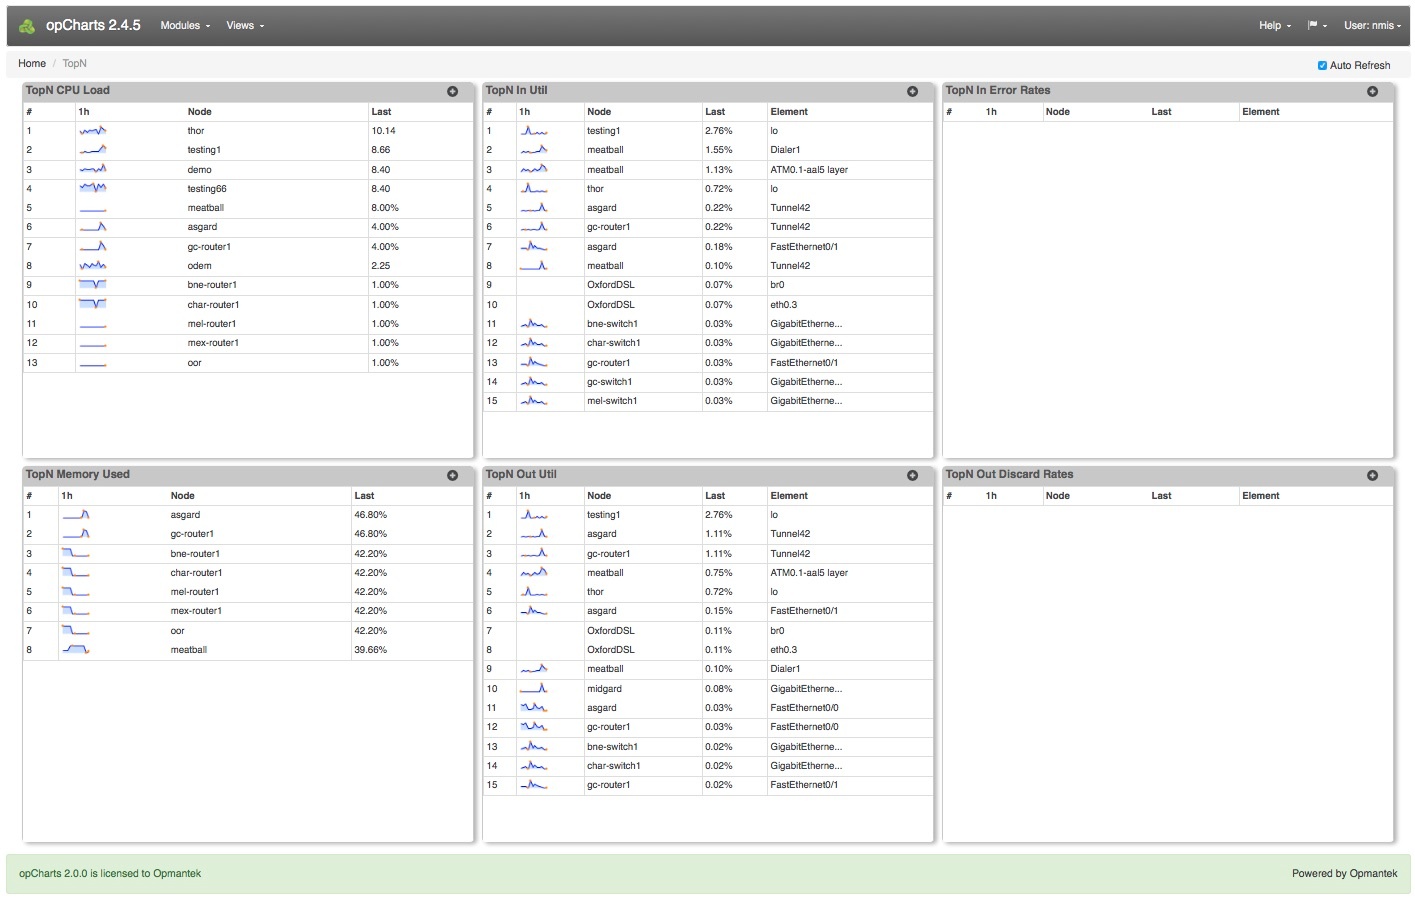
TopN View
The open the TopN View, select Views -> TopN from the opCharts menu bar. The TopN view is actually a collection, or predefined dashboard, comprised of six opCharts Components. Any of these TopN charts can each be added to a new or existing Dashboard (see: Dashboards for more information) to create custom views. The small graphs for each TopN are called "sparklines", they give you an impression of the full graph which you can see by clicking on the TopN.
Detail Pages
Please see these additional pages for more detailed information on using opCharts.
| Children Display | ||
|---|---|---|
|