Manage multiple locations concept.
Many organizations have more than one location that have devices which need to be monitored. These locations can be spread throughout a city, country, or continent depending on the organization. opCharts combined with NMIS allows you to create groups, assign them to locations, and view them on a geographical map. This geographical map gives you a high level view of how many as well as what devices are located where. From the high level view you also have the ability to drill into each location to view device health information, or drill into a specific device even further opening up the nodes detail page in opCharts on the selected device. The goal of this guide is to get you a useful map similar to the one in the image below.
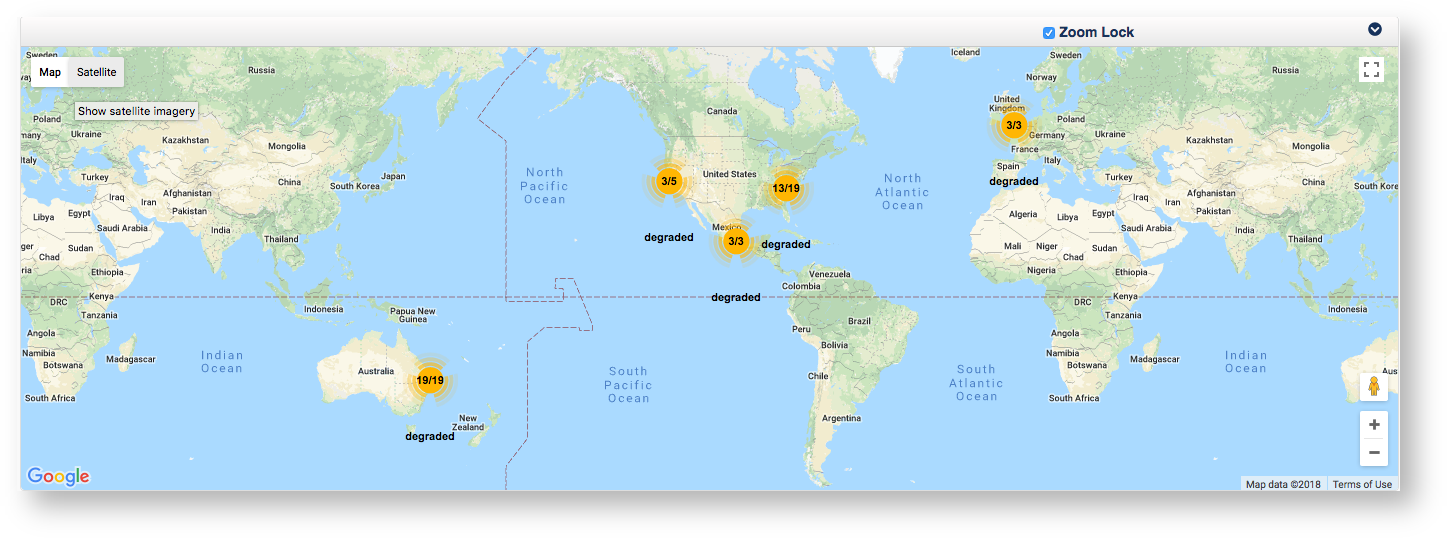
All of these yellow circles on the map are called clusters and are completely interact-able giving you a high level view of what devices are having trouble at what location. Notice some of the clusters display 3/5, 13/19, these are indicating there are 2/5, or 6/19 devices with issues that need to be investigated. These devices could be degraded or unreachable, this view lets you quickly identify which locations need attention. For example, clicking on the cluster seemingly located in California displaying 3/5 generates the map below:
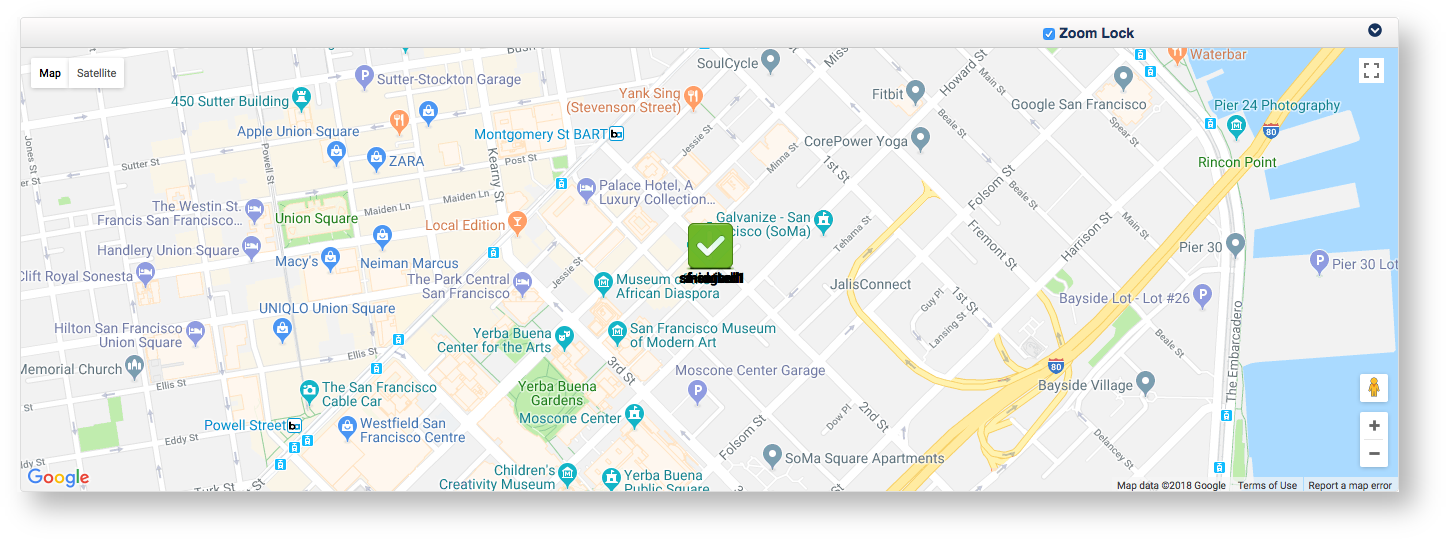
You can see by default all of the devices are stacked on top of each other, this is done on purpose since these devices are in one location and you can drag each device individually on this map. The best way to view every device is to left-click on the device, this spreads the devices out in an easier to view manner as shown below. From this view we notice there are three devices that need attention: meatball, midgard, sf-server1.

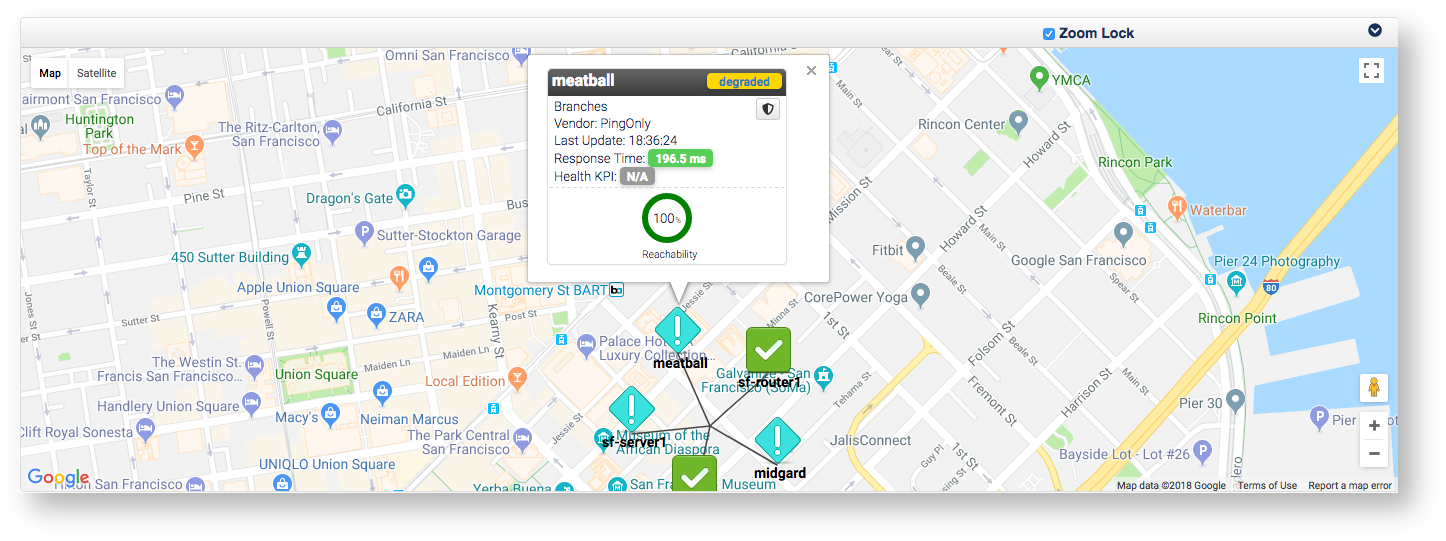
Clicking on the device "meatball' generates the image below - you can see this device is degraded, clicking on the device name in this popup window will open the devices Nodes detail page in opCharts allowing for quick investigation into events that may have caused it to become degraded.