1. Overview
In this tutorial, we will extending the model initially created for the Tutorial: NMIS8, create a new model.
- To obtain useful data to be used on the model.
- Add new metrics.
- Add new graphs.
- Add new thresholds.
What you’ll need
Our Opmantek Virtual Appliance (VM) from Opmantek.com
- You must have done the previous tutorial (Tutorial: NMIS8, create a new model)
2. Set up your environment
For this tutorial, my NMIS8 environment is using 192.168.1.100, this IP address may be different on your set up.
You need to access the VM via SSH to edit the configuration files, the default credentials for the VM are:
username: root
password: NM1$88
3. Objects to monitor
As we have seen in the previous tutorial, we need to obtain the relevant information about the objects to model it for the device. We could get these details directly from the vendor or if the objects are more common, we can search online to obtain more details about them. In this case, we need to model relevant Objects from the Mib 2 - IP MIB Group 1.3.6.1.2.1.4 iso(1). org(3). dod(6). internet(1). mgmt(2). mib-2(1). ip(4).
IP | GROUP | 1.3.6.1.2.1.4 iso(1). org(3). dod(6). internet(1). mgmt(2). mib-2(1). ip(4) | ||||
ipForwarding | SCALAR | read-write | INTEGER | 1.3.6.1.2.1.4.1 | ||
ipDefaultTTL | SCALAR | read-write | INTEGER | 1.3.6.1.2.1.4.2 | ||
ipInReceives | SCALAR | read-only | Counter | 1.3.6.1.2.1.4.3 | ||
ipInHdrErrors | SCALAR | read-only | Counter | 1.3.6.1.2.1.4.4 | ||
ipInAddrErrors | SCALAR | read-only | Counter | 1.3.6.1.2.1.4.5 | ||
ipForwDatagrams | SCALAR | read-only | Counter | 1.3.6.1.2.1.4.6 | ||
ipInUnknownProtos | SCALAR | read-only | Counter | 1.3.6.1.2.1.4.7 | ||
ipInDiscards | SCALAR | read-only | Counter | 1.3.6.1.2.1.4.8 | ||
ipInDelivers | SCALAR | read-only | Counter | 1.3.6.1.2.1.4.9 | ||
ipOutRequests | SCALAR | read-only | Counter | 1.3.6.1.2.1.4.10 | ||
ipOutDiscards | SCALAR | read-only | Counter | 1.3.6.1.2.1.4.11 | ||
ipOutNoRoutes | SCALAR | read-only | Counter | 1.3.6.1.2.1.4.12 | ||
ipReasmTimeout | SCALAR | read-only | INTEGER | 1.3.6.1.2.1.4.13 | ||
ipReasmReqds | SCALAR | read-only | Counter | 1.3.6.1.2.1.4.14 | ||
ipReasmOKs | SCALAR | read-only | Counter | 1.3.6.1.2.1.4.15 | ||
ipReasmFails | SCALAR | read-only | Counter | 1.3.6.1.2.1.4.16 | ||
ipFragOKs | SCALAR | read-only | Counter | 1.3.6.1.2.1.4.17 | ||
ipFragFails | SCALAR | read-only | Counter | 1.3.6.1.2.1.4.18 | ||
ipFragCreates | SCALAR | read-only | Counter | 1.3.6.1.2.1.4.19 | ||
ipAddrTable | TABLE | not-accessible | SEQUENCE OF | 1.3.6.1.2.1.4.20 | ||
| ipAddrEntry | ENTRY | not-accessible | IpAddrEntry | 1.3.6.1.2.1.4.20.1 | |
| ipAdEntAddr | TABULAR | read-only | IpAddress | 1.3.6.1.2.1.4.20.1.1 | |
ipAdEntIfIndex | TABULAR | read-only | INTEGER | 1.3.6.1.2.1.4.20.1.2 | ||
ipAdEntNetMask | TABULAR | read-only | IpAddress | 1.3.6.1.2.1.4.20.1.3 | ||
ipAdEntBcastAddr | TABULAR | read-only | INTEGER | 1.3.6.1.2.1.4.20.1.4 | ||
ipAdEntReasmMaxSize | TABULAR | read-only | INTEGER ( 0..65535 ) | 1.3.6.1.2.1.4.20.1.5 | ||
ipRouteTable | TABLE | not-accessible | SEQUENCE OF | 1.3.6.1.2.1.4.21 | ||
| ipRouteEntry | ENTRY | not-accessible | IpRouteEntry | 1.3.6.1.2.1.4.21.1 | |
| ipRouteDest | TABULAR | read-write | IpAddress | 1.3.6.1.2.1.4.21.1.1 | |
ipRouteIfIndex | TABULAR | read-write | INTEGER | 1.3.6.1.2.1.4.21.1.2 | ||
ipRouteMetric1 | TABULAR | read-write | INTEGER | 1.3.6.1.2.1.4.21.1.3 | ||
ipRouteMetric2 | TABULAR | read-write | INTEGER | 1.3.6.1.2.1.4.21.1.4 | ||
ipRouteMetric3 | TABULAR | read-write | INTEGER | 1.3.6.1.2.1.4.21.1.5 | ||
ipRouteMetric4 | TABULAR | read-write | INTEGER | 1.3.6.1.2.1.4.21.1.6 | ||
ipRouteNextHop | TABULAR | read-write | IpAddress | 1.3.6.1.2.1.4.21.1.7 | ||
ipRouteType | TABULAR | read-write | INTEGER | 1.3.6.1.2.1.4.21.1.8 | ||
ipRouteProto | TABULAR | read-only | INTEGER | 1.3.6.1.2.1.4.21.1.9 | ||
ipRouteAge | TABULAR | read-write | INTEGER | 1.3.6.1.2.1.4.21.1.10 | ||
ipRouteMask | TABULAR | read-write | IpAddress | 1.3.6.1.2.1.4.21.1.11 | ||
ipRouteMetric5 | TABULAR | read-write | INTEGER | 1.3.6.1.2.1.4.21.1.12 | ||
ipRouteInfo | TABULAR | read-only | OBJECT IDENTIFIER | 1.3.6.1.2.1.4.21.1.13 | ||
ipNetToMediaTable | TABLE | not-accessible | SEQUENCE OF | 1.3.6.1.2.1.4.22 | ||
| ipNetToMediaEntry | ENTRY | not-accessible | IpNetToMediaEntry | 1.3.6.1.2.1.4.22.1 | |
| ipNetToMediaIfIndex | TABULAR | read-write | INTEGER | 1.3.6.1.2.1.4.22.1.1 | |
ipNetToMediaPhysAddress | TABULAR | read-write | PhysAddress | 1.3.6.1.2.1.4.22.1.2 | ||
ipNetToMediaNetAddress | TABULAR | read-write | IpAddress | 1.3.6.1.2.1.4.22.1.3 | ||
ipNetToMediaType | TABULAR | read-write | INTEGER | 1.3.6.1.2.1.4.22.1.4 | ||
ipRoutingDiscards | SCALAR | read-only | Counter | 1.3.6.1.2.1.4.23 | ||
Now get the devices snmp data using snmpwalk. We will request data from the OID:
$ snmpwalk -v 2c -c nmisGig8 192.168.1.100 1.3.6.1.2.1.4
To make the returned data more useful and easier to interprete, we put the results in a table that shows the OID, the numerical OID and the value.
| OID | Numerical OID | Value |
| IP-MIB::ipForwarding.0 | .1.3.6.1.2.1.4.1.0 | INTEGER: 2 |
| IP-MIB::ipDefaultTTL.0 | .1.3.6.1.2.1.4.2.0 | INTEGER: 64 |
| IP-MIB::ipInReceives.0 | .1.3.6.1.2.1.4.3.0 | Counter32: 1137737 |
| IP-MIB::ipInHdrErrors.0 | .1.3.6.1.2.1.4.4.0 | Counter32: 0 |
| IP-MIB::ipInAddrErrors.0 | .1.3.6.1.2.1.4.5.0 | Counter32: 170 |
| IP-MIB::ipForwDatagrams.0 | .1.3.6.1.2.1.4.6.0 | Counter32: 0 |
| IP-MIB::ipInUnknownProtos.0 | .1.3.6.1.2.1.4.7.0 | Counter32: 0 |
| IP-MIB::ipInDiscards.0 | .1.3.6.1.2.1.4.8.0 | Counter32: 0 |
| IP-MIB::ipInDelivers.0 | .1.3.6.1.2.1.4.9.0 | Counter32: 1137567 |
| IP-MIB::ipOutRequests.0 | .1.3.6.1.2.1.4.10.0 | Counter32: 1150410 |
| IP-MIB::ipOutDiscards.0 | .1.3.6.1.2.1.4.11.0 | Counter32: 0 |
| IP-MIB::ipOutNoRoutes.0 | .1.3.6.1.2.1.4.12.0 | Counter32: 43108 |
| IP-MIB::ipReasmTimeout.0 | .1.3.6.1.2.1.4.13.0 | INTEGER: 0 |
| IP-MIB::ipReasmReqds.0 | .1.3.6.1.2.1.4.14.0 | Counter32: 0 |
| IP-MIB::ipReasmOKs.0 | .1.3.6.1.2.1.4.15.0 | Counter32: 0 |
| IP-MIB::ipReasmFails.0 | .1.3.6.1.2.1.4.16.0 | Counter32: 0 |
| IP-MIB::ipFragOKs.0 | .1.3.6.1.2.1.4.17.0 | Counter32: 0 |
| IP-MIB::ipFragFails.0 | .1.3.6.1.2.1.4.18.0 | Counter32: 0 |
| IP-MIB::ipFragCreates.0 | .1.3.6.1.2.1.4.19.0 | Counter32: 0 |
| IP-MIB::ipAdEntAddr.127.0.0.1 | .1.3.6.1.2.1.4.20.1.1.127.0.0.1 | IpAddress: 127.0.0.1 |
| IP-MIB::ipAdEntAddr.192.168.1.100 | .1.3.6.1.2.1.4.20.1.1.192.168.1.100 | IpAddress: 192.168.1.100 |
| IP-MIB::ipAdEntIfIndex.127.0.0.1 | .1.3.6.1.2.1.4.20.1.2.127.0.0.1 | INTEGER: 1 |
| IP-MIB::ipAdEntIfIndex.192.168.1.100 | .1.3.6.1.2.1.4.20.1.2.192.168.1.100 | INTEGER: 2 |
| IP-MIB::ipAdEntNetMask.127.0.0.1 | .1.3.6.1.2.1.4.20.1.3.127.0.0.1 | IpAddress: 255.0.0.0 |
| IP-MIB::ipAdEntNetMask.192.168.1.100 | .1.3.6.1.2.1.4.20.1.3.192.168.1.100 | IpAddress: 255.255.255.0 |
| IP-MIB::ipAdEntBcastAddr.127.0.0.1 | .1.3.6.1.2.1.4.20.1.4.127.0.0.1 | INTEGER: 0 |
| IP-MIB::ipAdEntBcastAddr.192.168.1.100 | .1.3.6.1.2.1.4.20.1.4.192.168.1.100 | INTEGER: 1 |
| IP-MIB::ip.21.1.1.192.168.1.0 | .1.3.6.1.2.1.4.21.1.1.192.168.1.0 | IpAddress: 192.168.1.0 |
| IP-MIB::ip.21.1.2.192.168.1.0 | .1.3.6.1.2.1.4.21.1.2.192.168.1.0 | INTEGER: 2 |
| IP-MIB::ip.21.1.3.192.168.1.0 | .1.3.6.1.2.1.4.21.1.3.192.168.1.0 | INTEGER: 0 |
| IP-MIB::ip.21.1.7.192.168.1.0 | .1.3.6.1.2.1.4.21.1.7.192.168.1.0 | IpAddress: 0.0.0.0 |
| IP-MIB::ip.21.1.8.192.168.1.0 | .1.3.6.1.2.1.4.21.1.8.192.168.1.0 | INTEGER: 3 |
| IP-MIB::ip.21.1.9.192.168.1.0 | .1.3.6.1.2.1.4.21.1.9.192.168.1.0 | INTEGER: 2 |
| IP-MIB::ip.21.1.11.192.168.1.0 | .1.3.6.1.2.1.4.21.1.11.192.168.1.0 | IpAddress: 255.255.255.0 |
| IP-MIB::ip.21.1.13.192.168.1.0 | .1.3.6.1.2.1.4.21.1.13.192.168.1.0 | OID: .0.0 |
| IP-MIB::ipNetToMediaIfIndex.2.192.168.1.59 | .1.3.6.1.2.1.4.22.1.1.2.192.168.1.59 | INTEGER: 2 |
| IP-MIB::ipNetToMediaPhysAddress.2.192.168.1.59 | .1.3.6.1.2.1.4.22.1.2.2.192.168.1.59 | STRING: 50:eb:71:57:ee:a5 |
| IP-MIB::ipNetToMediaNetAddress.2.192.168.1.59 | .1.3.6.1.2.1.4.22.1.3.2.192.168.1.59 | IpAddress: 192.168.1.59 |
| IP-MIB::ipNetToMediaType.2.192.168.1.59 | .1.3.6.1.2.1.4.22.1.4.2.192.168.1.59 | INTEGER: 3 |
| IP-MIB::ipRoutingDiscards.0 | .1.3.6.1.2.1.4.23.0 | Counter32: 0 |
After carefully analysing the object that are useful for our case, we have decided to add these objects: "ipForwDatagrams", "ipFragCreates", "ipFragFails", "ipFragOKs", "ipInAddrErrors", "ipInDelivers", "ipInDiscards", "ipInHdrErrors", "ipInReceives", "ipInUnknownProtos", "ipOutDiscards", "ipOutRequests", "ipReasmFails", "ipReasmOKs" and "ipReasmReqds. This table only shows these selected objects.
| OID | Numerical OID | Value | Description |
| IP-MIB::ipInReceives.0 | .1.3.6.1.2.1.4.3.0 | Counter32: 1137737 | The total number of input datagrams received from interfaces, including those received in error. |
| IP-MIB::ipInHdrErrors.0 | .1.3.6.1.2.1.4.4.0 | Counter32: 0 | The number of input datagrams discarded due to errors in their IPv4 headers, including bad checksums, version number mismatch, other format errors, time-to-live exceeded, errors discovered in processing their IPv4 options, etc. |
| IP-MIB::ipInAddrErrors.0 | .1.3.6.1.2.1.4.5.0 | Counter32: 170 | The number of input datagrams discarded because the IPv4 address in their IPv4 header's destination field was not a valid address to be received at this entity. This count includes invalid addresses (e.g., 0.0.0.0) and addresses of unsupported Classes (e.g., Class E). For entities which are not IPv4 routers, and therefore do not forward datagrams, this counter includes datagrams discarded because the destination address was not a local address. |
| IP-MIB::ipForwDatagrams.0 | .1.3.6.1.2.1.4.6.0 | Counter32: 0 | The number of input datagrams for which this entity was not their final IPv4 destination, as a result of which an attempt was made to find a route to forward them to that final destination. In entities which do not act as IPv4 routers, this counter will include only those packets which were Source-Routed via this entity, and the Source-Route option processing was successful. |
| IP-MIB::ipInUnknownProtos.0 | .1.3.6.1.2.1.4.7.0 | Counter32: 0 | The number of locally-addressed datagrams received successfully but discarded because of an unknown or unsupported protocol. |
| IP-MIB::ipInDiscards.0 | .1.3.6.1.2.1.4.8.0 | Counter32: 0 | The number of input IPv4 datagrams for which no problems were encountered to prevent their continued processing, but which were discarded (e.g., for lack of buffer space). Note that this counter does not include any datagrams discarded while awaiting re-assembly. |
| IP-MIB::ipInDelivers.0 | .1.3.6.1.2.1.4.9.0 | Counter32: 1137567 | The total number of input datagrams successfully delivered to IPv4 user-protocols (including ICMP). |
| IP-MIB::ipOutRequests.0 | .1.3.6.1.2.1.4.10.0 | Counter32: 1150410 | The total number of IPv4 datagrams which local IPv4 user protocols (including ICMP) supplied to IPv4 in requests for transmission. Note that this counter does not include any datagrams counted in ipForwDatagrams. |
| IP-MIB::ipOutDiscards.0 | .1.3.6.1.2.1.4.11.0 | Counter32: 0 | The number of output IPv4 datagrams for which no problem was encountered to prevent their transmission to their destination, but which were discarded (e.g., for lack of buffer space). Note that this counter would include datagrams counted in ipForwDatagrams if any such packets met this (discretionary) discard criterion. |
| IP-MIB::ipReasmReqds.0 | .1.3.6.1.2.1.4.14.0 | Counter32: 0 | The number of IPv4 fragments received which needed to be reassembled at this entity. |
| IP-MIB::ipReasmOKs.0 | .1.3.6.1.2.1.4.15.0 | Counter32: 0 | The number of IPv4 datagrams successfully re-assembled. |
| IP-MIB::ipReasmFails.0 | .1.3.6.1.2.1.4.16.0 | Counter32: 0 | The number of failures detected by the IPv4 re-assembly algorithm (for whatever reason: timed out, errors, etc). |
| IP-MIB::ipFragOKs.0 | .1.3.6.1.2.1.4.17.0 | Counter32: 0 | The number of IPv4 datagrams that have been successfully fragmented at this entity. |
| IP-MIB::ipFragFails.0 | .1.3.6.1.2.1.4.18.0 | Counter32: 0 | The number of IPv4 datagrams that have been discarded because they needed to be fragmented at this entity but could not be, e.g., because their Don't Fragment flag was set. |
| IP-MIB::ipFragCreates.0 | .1.3.6.1.2.1.4.19.0 | Counter32: 0 | The number of IPv4 datagram fragments that have been generated as a result of fragmentation at this entity. |
4. Model Implementation
This time, we will be mapping the Numeric OIDs to a more descriptive name, in this case, we call them as it is specified on the MIB. To do this, we have to edit the /usr/local/nmis8/mibs/nmis_mibs.oid file and add the entries. Once we have done this, the NMIS will be able to identify the name and replace it by the numeric OID.
--snip--

"ipInReceives"		"1.3.6.1.2.1.4.3"
"ipInHdrErrors"		"1.3.6.1.2.1.4.4"
"ipInAddrErrors"		"1.3.6.1.2.1.4.5"
"ipForwDatagrams"		"1.3.6.1.2.1.4.6"
"ipInUnknownProtos"		"1.3.6.1.2.1.4.7"
"ipInDiscards"		"1.3.6.1.2.1.4.8"
"ipInDelivers"		"1.3.6.1.2.1.4.9"
"ipOutRequests"		"1.3.6.1.2.1.4.10"
"ipOutDiscards"		"1.3.6.1.2.1.4.11"
"ipReasmReqds"		"1.3.6.1.2.1.4.14"
"ipReasmOKs"		"1.3.6.1.2.1.4.15"
"ipReasmFails"		"1.3.6.1.2.1.4.16"
"ipFragOKs"		"1.3.6.1.2.1.4.17"
"ipFragFails"		"1.3.6.1.2.1.4.18"
"ipFragCreates"		"1.3.6.1.2.1.4.19"
"ipOutNoRoutes"		"1.3.6.1.2.1.4.12"

--snip--
Now that we can edit our /usr/local/nmis8/model/Model-Debian.snmp model and add a new section called: "mib2ip" just under the section "laload" inside "System → rrd". Also, inside this new section we add a "snmp" section which will contain our new data to collect.
--snip--
  'system' => {
    'nodegraph' => 'laload',
    'rrd' => {
      'laload' => {
        'graphtype' => 'laload',
        'snmp' => {
          'laLoad1' => {
            'oid' => '1.3.6.1.4.1.2021.10.1.3.1',
            'option' => 'gauge,0:U'
          },
          'laLoad5' => {
            'oid' => '1.3.6.1.4.1.2021.10.1.3.2',
            'option' => 'gauge,0:U'
          }
        }
      },
      'mib2ip' => {
        'snmp' => {

        }
      },
    },
--snip--
Now that we have decided the name of the new section, we have to add it to the /usr/local/nmis8/models/Common-database.nmis and pair it to the location where the RRD will be stored.
The filename of the RRD file must be unique, it is important to verify that the name has not been used before in the Common-database.nmis. Also, the name given to associate the entry on the Common-database.nmis must match the name given on the model.
--snip--
      'mib2ip' => '/nodes/$node/health/mib2ip.rrd',
--snip--
Inside the "mib2ip → snmp" section, we add the first object or element to the model, the "ipInReceives". Because we already map the OID to a name, we dont need to use the numeric OID anymore. From the Snmpwalk we know that the data that is contained by the object is categorised as a "Counter" and that it stores only positive values, for this reason we have to set the "option" item as: 'counter,0:U', where "U" could be interpreted as "Unlimited".
--snip--
      'mib2ip' => {
        'snmp' => {
          'ipInReceives' => {
            'oid' => 'ipInReceives',
            'option' => 'counter,0:U'
          }
        }
      }
--snip--
In similar fashion, we add the other objects to the model. Also, remember to temporarily use 'no_graphs' => '1' inside the "mib2ip" section before testing our implementation to avoid errors related to graphs for this section. Once we have done that, the "mib2ip" section may look as follows:
--snip--
      'mib2ip' => {
        'no_graphs' => '1',
        'snmp' => {
          'ipInReceives' => {
            'oid' => 'ipInReceives',
            'option' => 'counter,0:U'
          },
          'ipInHdrErrors' => {
            'oid' => 'ipInHdrErrors',
            'option' => 'counter,0:U'
          },
          'ipInAddrErrors' => {
            'oid' => 'ipInAddrErrors',
            'option' => 'counter,0:U'
          },
          'ipForwDatagrams' => {
            'oid' => 'ipForwDatagrams',
            'option' => 'counter,0:U'
          },
          'ipInUnknownProtos' => {
            'oid' => 'ipInUnknownProtos',
            'option' => 'counter,0:U'
          },
          'ipInDiscards' => {
            'oid' => 'ipInDiscards',
            'option' => 'counter,0:U'
          },
          'ipInDelivers' => {
            'oid' => 'ipInDelivers',
            'option' => 'counter,0:U'
          },
          'ipOutRequests' => {
            'oid' => 'ipOutRequests',
            'option' => 'counter,0:U'
          },
          'ipOutDiscards' => {
            'oid' => 'ipOutDiscards',
            'option' => 'counter,0:U'
          },
          'ipReasmReqds' => {
            'oid' => 'ipReasmReqds',
            'option' => 'counter,0:U'
          },
          'ipReasmOKs' => {
            'oid' => 'ipReasmOKs',
            'option' => 'counter,0:U'
          },
          'ipReasmFails' => {
            'oid' => 'ipReasmFails',
            'option' => 'counter,0:U'
          },
          'ipFragOKs' => {
            'oid' => 'ipFragOKs',
            'option' => 'counter,0:U'
          },
          'ipFragFails' => {
            'oid' => 'ipFragFails',
            'option' => 'counter,0:U'
          },
          'ipFragCreates' => {
            'oid' => 'ipFragCreates',
            'option' => 'counter,0:U'
          }
        }
      },
--snip--
After executing an Update and a Collect, we can verify that our addition to the model is working:
--snip--
MODEL getData Debian9 Opmantek VM class=system:
  section=laload index= port=
    oid=1.3.6.1.4.1.2021.10.1.3.1 name=laLoad1 value=0.22
    oid=1.3.6.1.4.1.2021.10.1.3.2 name=laLoad5 value=0.07
  section=mib2ip index= port=
    oid=ipInAddrErrors name=ipInAddrErrors value=328
    oid=ipInUnknownProtos name=ipInUnknownProtos value=0
    oid=ipInDiscards name=ipInDiscards value=0
    oid=ipFragFails name=ipFragFails value=0
    oid=ipReasmFails name=ipReasmFails value=0
    oid=ipForwDatagrams name=ipForwDatagrams value=0
    oid=ipOutDiscards name=ipOutDiscards value=0
    oid=ipFragCreates name=ipFragCreates value=0
    oid=ipReasmReqds name=ipReasmReqds value=0
    oid=ipInDelivers name=ipInDelivers value=1825396
    oid=ipInReceives name=ipInReceives value=1825724
    oid=ipFragOKs name=ipFragOKs value=0
    oid=ipInHdrErrors name=ipInHdrErrors value=0
    oid=ipReasmOKs name=ipReasmOKs value=0
    oid=ipOutRequests name=ipOutRequests value=1962158
--snip--
Now that we have verified that our model is gathering the data, we can proceed to create the graphs.
5. Graph Implementation
Now we can create a useful graph which can display stats about IP Packets and the filename must be"Graph-ip.nmis". The graph itself is called "ip" and we must use this name to call the graph from the model. We have to specify this on the model by replacing: 'no_graphs' => '1', for 'graphtype' => 'ip', and adding "ip" to the "nodegraph" item. ('nodegraph' => 'laload,ip', ).
--snip--
 'system' => {
    'nodegraph' => 'laload,ip',
    'rrd' => {
      'laload' => {
        'graphtype' => 'laload',
        'snmp' => {
          'laLoad1' => {
            'oid' => '1.3.6.1.4.1.2021.10.1.3.1',
            'option' => 'gauge,0:U'
          },
          'laLoad5' => {
            'oid' => '1.3.6.1.4.1.2021.10.1.3.2',
            'option' => 'gauge,0:U'
          }
        }
      },
      'mib2ip' => {
        'graphtype' => 'ip',
        'snmp' => {
          'ipInReceives' => {
            'oid' => 'ipInReceives',
            'option' => 'counter,0:U'
          },
          'ipInHdrErrors' => {
            'oid' => 'ipInHdrErrors',
            'option' => 'counter,0:U'
          },
Because we have already decided the name of the graph and have added it to the model. We have to add the graph heading and description, this sets the name of the graph that NMIS will invoke for a particular RRD file. In order for the graph heading to be correct this variable with its associated description needs to be added to the Common-heading.nmis file.
--snip--
      'ip' => 'IP Utilisation',
--snip--
Graph-ip.nmis
To start, we add the basic structure of a graph.
Here we add the "title" section, it contains the 2 versions to be displayed depending on the size of the graph. It accepts common NMIS variables as: $node, $length, $datestamp_start,$datestamp_end,etc.
The vertical label, specified as "vlabel" section. It is shown on the left side of the graph.
The most important section: "option" section. We have to define our variables, operations, legends, and styles here. Also we can specify how the graph should look for the standard size or the small size. Please notice that the option name is "small" which differs from the other 2 previous items.
%hash = (
	'title' => {
		'standard' => '$node - $length from $datestamp_start to $datestamp_end',
		'short' => '$node - $length'
	},
	'vlabel' => {
		'standard' => 'IP Packet Statistics',
		'short' => 'IP Packet Stats'
	},
	'option' => {
		'standard' => [

		],
		'small' => [

		]
	}
);
Now we need to create the graph from data collected, for this we need be more familiar with The graph function of RRDtool and for this first section we will make reference to the syntax used for the rrdgraph_data.
We will use the items: ipInReceives, ipInDelivers, ipOutRequests and ipForwDatagrams. To keep it simple, we will only graph a line for the first line (ipInReceives), this line will have the HEX color #ff0000(red) and the label "IP Packets Received".
  %hash = (
	'title' => {
		'standard' => '$node - $length from $datestamp_start to $datestamp_end',
		'short' => '$node - $length'
	},
	'vlabel' => {
		'standard' => 'IP Packet Statistics',
		'short' => 'IP Packet Stats'
	},
	'option' => {
		'standard' => [
			'DEF:ipInReceives=$database:ipInReceives:AVERAGE',

		    'LINE1:ipInReceives#ff0000:IP Packets Received',
		]
	}
);

Now that we were able to graph one line, we will be adding the others 3 items, giving them different colours and descriptions. Also we need make it more descriptive, so we add the Average value to the labels of the legend. For this we will use:
'GPRINT:ipInReceives:AVERAGE:Avg %6.0lf \\n',
GPRINT:variable:CF:Format
variable: To specify the data that is associated with.
CF: Consolidation Function, can be AVERAGE, MINIMUM, MAXIMUM, and LAST
Format: The description shown, the number format and line formatting.
e.g: "Avg %6.0lf \\n" → "Avg" is the textual description, "%6.0lf" is the placeholder for the returned value, the value on the left side of the "." indicates the number of whole digits to show(6) and on the right side of the ".", the amount of decimal digits, in this case (0). "\\n" specify a line return".
  %hash = (
	'title' => {
		'standard' => '$node - $length from $datestamp_start to $datestamp_end',
		'short' => '$node - $length'
	},
	'vlabel' => {
		'standard' => 'IP Packet Statistics',
		'short' => 'IP Packet Stats'
	},
	'option' => {
		'standard' => [
			'DEF:ipInReceives=$database:ipInReceives:AVERAGE',
			'DEF:ipInDelivers=$database:ipInDelivers:AVERAGE',
			'DEF:ipOutRequests=$database:ipOutRequests:AVERAGE',
			'DEF:ipForwDatagrams=$database:ipForwDatagrams:AVERAGE',

		    'LINE1:ipInReceives#ff0000:IP Packets Received',
			'GPRINT:ipInReceives:AVERAGE:Avg %6.0lf\\n',

			'LINE1:ipInDelivers#000000:IP Packets Local',
			'GPRINT:ipInDelivers:AVERAGE:Avg %6.0lf\\n',

			'LINE1:ipOutRequests#00FF7F:IP Packets Sent',
			'GPRINT:ipOutRequests:AVERAGE:Avg %6.0lf\\n',

			'LINE1:ipForwDatagrams#40E0D0:IP Packets Forwarded',
			'GPRINT:ipForwDatagrams:AVERAGE:Avg %6.0lf\\n',

		]
	}
);
This is what we get using this options:
As we can see, the lines are overlapping each other and this makes the graph complicated to read. It is needed to invert the lines of ipInReceives and ipInDelivers. We can achieve this by multiplying the obtained values by "-1". How do we do this?, will introduce the use of CDEF to do math calculation to the values obtained.
'CDEF:ipInReceivesSplit=ipInReceives,-1,*',CDEF:NewVariable=RPN_expression
CDEF: Indicates the Calculation Definition. More details about the RRDtool's CDEF language.
NewVariable= Is the assignation of a new variable to hold the result performed by the calculation.
RPN_expression The Reverse Polish Notation expression used to calculate the new value. More info here.
e.g: The expression: CDEF:ipInReceivesSplit=ipInReceives,-1,* means that the variable ipInReceives will be multiplied (*) by "-1" and the value will be stored in "ipInReceivesSplit".
Now that we have the new value stored on a different variable, we need to adjust our graph to show this new data instead of the previously defined. We will do this for the "ipInDelivers" too.
	'option' => {
		'standard' => [
			'DEF:ipInReceives=$database:ipInReceives:AVERAGE',
			'DEF:ipInDelivers=$database:ipInDelivers:AVERAGE',
			'DEF:ipOutRequests=$database:ipOutRequests:AVERAGE',
			'DEF:ipForwDatagrams=$database:ipForwDatagrams:AVERAGE',

			'CDEF:ipInReceivesSplit=ipInReceives,-1,*',
			'CDEF:ipInDeliversSplit=ipInDelivers,-1,*',

		    'LINE1:ipInReceivesSplit#ff0000:IP Packets Received',
			'GPRINT:ipInReceives:AVERAGE:Avg %6.0lf\\n',

			'LINE1:ipInDeliversSplit#000000:IP Packets Local',
			'GPRINT:ipInDelivers:AVERAGE:Avg %6.0lf\\n',

			'LINE1:ipOutRequests#00FF7F:IP Packets Sent',
			'GPRINT:ipOutRequests:AVERAGE:Avg %6.0lf\\n',

			'LINE1:ipForwDatagrams#40E0D0:IP Packets Forwarded',
			'GPRINT:ipForwDatagrams:AVERAGE:Avg %6.0lf\\n',

		]
	}
Note that the change was done only for "LINE1" and not for the GPRINT

Now look better, however we need to color the area created by the ipInReceivesSplit and ipOutRequeststo make our graph more self descriptive. To achieved this, we change the drawing type of this data. We only have to replace "LINE1" for "AREA", as simple as that.
e.g: 'AREA:ipInReceivesSplit#ff0000:IP Packets Received'
Also, we would like to see the Max number of packets of each item along with the average.
e.g: 'GPRINT:ipInReceives:MAX:Max %6.0lf\\n',
	'option' => {
		'standard' => [
			'DEF:ipInReceives=$database:ipInReceives:AVERAGE',
			'DEF:ipInDelivers=$database:ipInDelivers:AVERAGE',
			'DEF:ipOutRequests=$database:ipOutRequests:AVERAGE',
			'DEF:ipForwDatagrams=$database:ipForwDatagrams:AVERAGE',

			'CDEF:ipInReceivesSplit=ipInReceives,-1,*',
			'CDEF:ipInDeliversSplit=ipInDelivers,-1,*',

		    'AREA:ipInReceivesSplit#ff0000:IP Packets Received',
			'GPRINT:ipInReceives:AVERAGE:Avg %6.0lf',
			'GPRINT:ipInReceives:MAX:Max %6.0lf\\n',

			'LINE1:ipInDeliversSplit#000000:IP Packets Local',
			'GPRINT:ipInDelivers:AVERAGE:Avg %6.0lf',
			'GPRINT:ipInDelivers:MAX:Max %6.0lf\\n',

			'AREA:ipOutRequests#00FF7F:IP Packets Sent',
			'GPRINT:ipOutRequests:AVERAGE:Avg %6.0lf',
			'GPRINT:ipOutRequests:MAX:Max %6.0lf\\n',

			'LINE1:ipForwDatagrams#40E0D0:IP Packets Forwarded',
			'GPRINT:ipForwDatagrams:AVERAGE:Avg %6.0lf',
			'GPRINT:ipForwDatagrams:MAX:Max %6.0lf\\n',
		]
	}
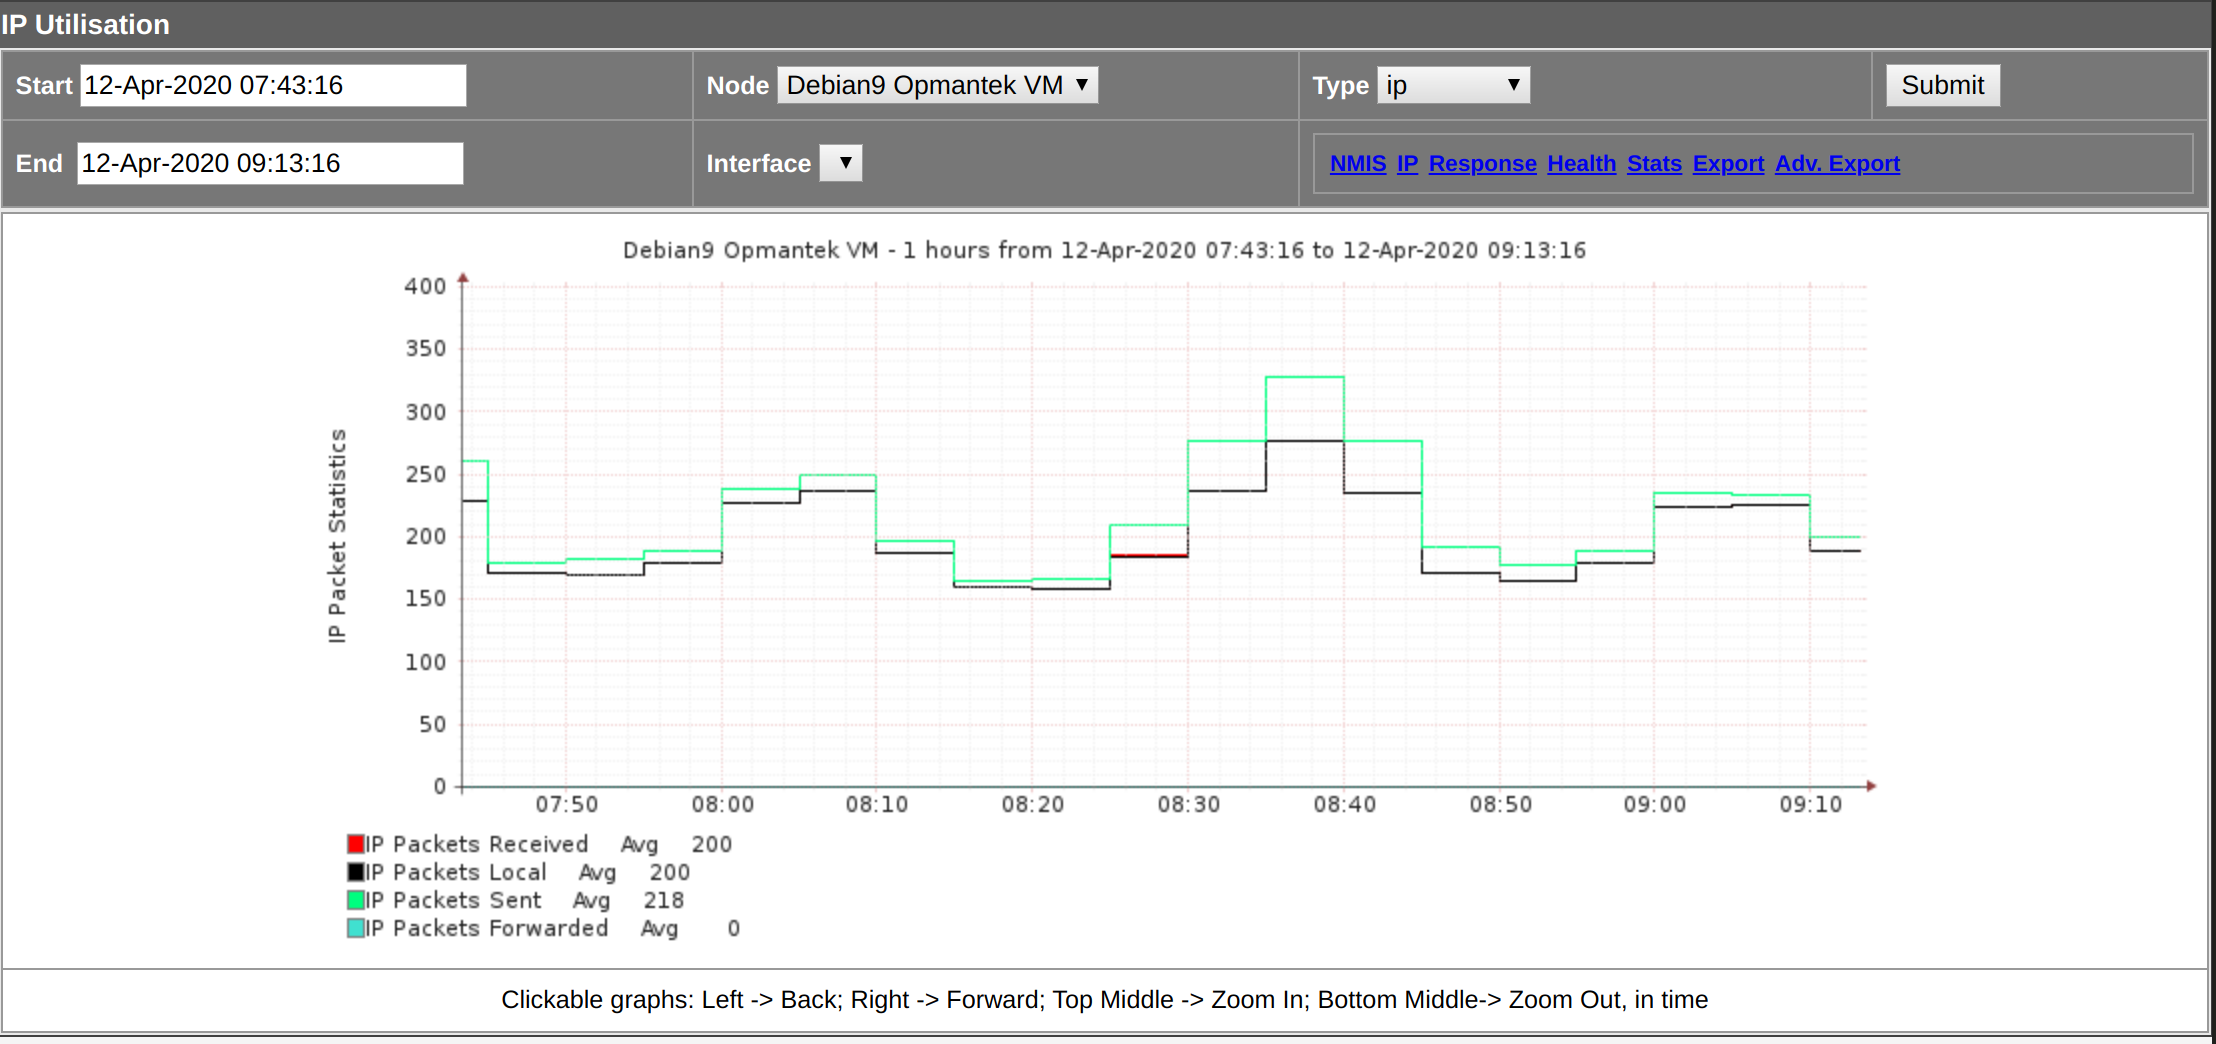
Our standard graph is completed and must look like this:

Now we would like to extend our graph and add the "small" section inside option. As we already have nice graph, maybe we can make the small graph less verbose. Let's copy the graph and remove the GPRINTs for the MAX values.
This is our final version of Graph-ip.nmis:
  %hash = (
	'title' => {
		'standard' => '$node - $length from $datestamp_start to $datestamp_end',
		'short' => '$node - $length'
	},
	'vlabel' => {
		'standard' => 'IP Packet Statistics',
		'short' => 'IP Packet Stats'
	},

	'option' => {
		'standard' => [
			'DEF:ipInReceives=$database:ipInReceives:AVERAGE',
			'DEF:ipInDelivers=$database:ipInDelivers:AVERAGE',
			'DEF:ipOutRequests=$database:ipOutRequests:AVERAGE',
			'DEF:ipForwDatagrams=$database:ipForwDatagrams:AVERAGE',

			'CDEF:ipInReceivesSplit=ipInReceives,-1,*',
			'CDEF:ipInDeliversSplit=ipInDelivers,-1,*',

		    'AREA:ipInReceivesSplit#ff0000:IP Packets Received',
			'GPRINT:ipInReceives:AVERAGE:Avg %6.0lf',
			'GPRINT:ipInReceives:MAX:Max %6.0lf\\n',

			'LINE1:ipInDeliversSplit#000000:IP Packets Local',
			'GPRINT:ipInDelivers:AVERAGE:Avg %6.0lf',
			'GPRINT:ipInDelivers:MAX:Max %6.0lf\\n',

			'AREA:ipOutRequests#00FF7F:IP Packets Sent',
			'GPRINT:ipOutRequests:AVERAGE:Avg %6.0lf',
			'GPRINT:ipOutRequests:MAX:Max %6.0lf\\n',

			'LINE1:ipForwDatagrams#40E0D0:IP Packets Forwarded',
			'GPRINT:ipForwDatagrams:AVERAGE:Avg %6.0lf',
			'GPRINT:ipForwDatagrams:MAX:Max %6.0lf\\n',
		],
		'small' => [
			'DEF:ipInReceives=$database:ipInReceives:AVERAGE',
			'DEF:ipInDelivers=$database:ipInDelivers:AVERAGE',
			'DEF:ipOutRequests=$database:ipOutRequests:AVERAGE',
			'DEF:ipForwDatagrams=$database:ipForwDatagrams:AVERAGE',

			'CDEF:ipInReceivesSplit=ipInReceives,-1,*',
			'CDEF:ipInDeliversSplit=ipInDelivers,-1,*',

		    'AREA:ipInReceivesSplit#ff0000:IP Packets Received',
			'GPRINT:ipInReceives:AVERAGE:Avg %6.0lf\\n',

			'LINE1:ipInDeliversSplit#000000:IP Packets Local',
			'GPRINT:ipInDelivers:AVERAGE:Avg %6.0lf\\n',

			'AREA:ipOutRequests#00FF7F:IP Packets Sent',
			'GPRINT:ipOutRequests:AVERAGE:Avg %6.0lf\\n',

			'LINE1:ipForwDatagrams#40E0D0:IP Packets Forwarded',
			'GPRINT:ipForwDatagrams:AVERAGE:Avg %6.0lf\\n',
		]
	}
);
This is how the small version of the graph must look:

Graph-frag.nmis
Now that we know how to make a useful graph for packets stats, it's time to build one for IP packet fragmentation and reassembly. This new graph will be identified as "frag" (short of "fragmentation") and we will have to add it to the system → nodegraph list and also to mib2ip → graphtype .
--snip--
 'system' => {
    'nodegraph' => 'laload,ip,frag',
    'rrd' => {
      'laload' => {
        'graphtype' => 'laload',
        'snmp' => {
          'laLoad1' => {
            'oid' => '1.3.6.1.4.1.2021.10.1.3.1',
            'option' => 'gauge,0:U'
          },
          'laLoad5' => {
            'oid' => '1.3.6.1.4.1.2021.10.1.3.2',
            'option' => 'gauge,0:U'
          }
        }
      },
      'mib2ip' => {
        'graphtype' => 'ip,frag',
        'snmp' => {
          'ipInReceives' => {
            'oid' => 'ipInReceives',
            'option' => 'counter,0:U'
          },
          'ipInHdrErrors' => {
            'oid' => 'ipInHdrErrors',
            'option' => 'counter,0:U'
          },
Now we create our basic graph template. Having "Fragmentation/Reassembly" on the "vlabel".
%hash = (
	'title' => {
		'standard' => '$node - $length from $datestamp_start to $datestamp_end',
		'short' => '$node - $length'
	},
	'vlabel' => {
		'standard' => 'Fragmentation/Reassembly'
	},
	'option' => {
		'standard' => [

		],
		'small' => [

		]
	}
);ipInDelivers
Do not forget to add the associated description to the Common-heading.nmis file.
--snip--
      'frag' => 'IP Fragmentation/Reassembly (as a % of Packets Received)',
--snip--
We will be using average values of these objects: "ipReasmReqds","ipReasmOKs","ipReasmFails","ipFragOKs","ipFragFails","ipFragCreates","ipInDelivers". Let's define them first:
'standard' => [
	'DEF:ipReasmReqds=$database:ipReasmReqds:AVERAGE',
	'DEF:ipReasmOKs=$database:ipReasmOKs:AVERAGE',
	'DEF:ipReasmFails=$database:ipReasmFails:AVERAGE',
	'DEF:ipFragOKs=$database:ipFragOKs:AVERAGE',
	'DEF:ipFragFails=$database:ipFragFails:AVERAGE',
	'DEF:ipFragCreates=$database:ipFragCreates:AVERAGE',
	'DEF:ipInDelivers=$database:ipInDelivers:AVERAGE',
],
Now, we have to make a calculation to obtain more useful data. For example, graphing only the objects themselves and showing the current average values is not really indicative, however, if we show the percentage of each object that correspond to the total it is more useful. The calculation is very simple:
The total number of input datagrams successfully delivered to IPv4 user-protocols (including ICMP) is represented by: "ipInDelivers", this will represent the 100%.
To calculate the percentage of IPv4 fragments received which needed to be reassembled (ipReasmReqds), we have to calculate:
ipReasmReqds divided by ipInDelivers and the result multiplied by 100, which is equivalent to: (ipReasmReqds / ipInDelivers) * 100
In Reverse Polish Notation (RPN) that will be: ipReasmReqds,ipInDelivers,/,100,*
The result of this calculation must be stored in a named variable, in this case we will call it: "ReasmReqds". Finally our CDEF or Calculation Definition should be:
'CDEF:ReasmReqds=ipReasmReqds,ipInDelivers,/,100,*'
Let's apply the same logic for all the other objects and we should get:
'standard' => [
	'DEF:ipReasmReqds=$database:ipReasmReqds:AVERAGE',
	'DEF:ipReasmOKs=$database:ipReasmOKs:AVERAGE',
	'DEF:ipReasmFails=$database:ipReasmFails:AVERAGE',
	'DEF:ipFragOKs=$database:ipFragOKs:AVERAGE',
	'DEF:ipFragFails=$database:ipFragFails:AVERAGE',
	'DEF:ipFragCreates=$database:ipFragCreates:AVERAGE',
	'DEF:ipInDelivers=$database:ipInDelivers:AVERAGE',

	'CDEF:ReasmReqds=ipReasmReqds,ipInDelivers,/,100,*',
	'CDEF:ReasmOKs=ipReasmOKs,ipInDelivers,/,100,*',
	'CDEF:ReasmFails=ipReasmFails,ipInDelivers,/,100,*',
	'CDEF:FragOKs=ipFragOKs,ipInDelivers,/,100,*',
	'CDEF:FragFails=ipFragFails,ipInDelivers,/,100,*',
	'CDEF:FragCreates=ipFragCreates,ipInDelivers,/,100,*',
],
Now we will add the lines to the graph, in this case we have decided to draw 4 lines (FragOKs,FragFails,ReasmOKs and ReasmFails), also we have decided to give a bit more of importance to the "Failed" objects, so the line width will be thicker.
'LINE1:FragOKs#00ff00:Fragmentation OK',
'LINE2:FragFails#ff0000:Fragmentation Fail',
Notice that the drawing style "LINE" is accompanied by a number, this number specifies the width of the line on the graph, it can be a floating point number.
'standard' => [
	'DEF:ipReasmReqds=$database:ipReasmReqds:AVERAGE',
	'DEF:ipReasmOKs=$database:ipReasmOKs:AVERAGE',
	'DEF:ipReasmFails=$database:ipReasmFails:AVERAGE',
	'DEF:ipFragOKs=$database:ipFragOKs:AVERAGE',
	'DEF:ipFragFails=$database:ipFragFails:AVERAGE',
	'DEF:ipFragCreates=$database:ipFragCreates:AVERAGE',
	'DEF:ipInDelivers=$database:ipInDelivers:AVERAGE',

	'CDEF:ReasmReqds=ipReasmReqds,ipInDelivers,/,100,*',
	'CDEF:ReasmOKs=ipReasmOKs,ipInDelivers,/,100,*',
	'CDEF:ReasmFails=ipReasmFails,ipInDelivers,/,100,*',
	'CDEF:FragOKs=ipFragOKs,ipInDelivers,/,100,*',
	'CDEF:FragFails=ipFragFails,ipInDelivers,/,100,*',
	'CDEF:FragCreates=ipFragCreates,ipInDelivers,/,100,*',

	'LINE1:FragOKs#00ff00:Fragmentation OK',
	'LINE2:FragFails#ff0000:Fragmentation Fail',
	'LINE1:ReasmOKs#0033aa:Reassembly OK',
	'LINE2:ReasmFails#000000:Reassembly Fail',
],

As we can see, we need to add the legend of the graph using GPRINT, which will show the values that we have calculated in the previous step. In addition, we are going to add a Comment to the legend of the graph:
'COMMENT: Calculated as a % of ipInDelivers'
COMMENT:text
Text is printed literally in the legend section of the graph.
Additional information about formatting options can be found in: https://oss.oetiker.ch/rrdtool/doc/rrdgraph_graph.en.html
'standard' => [
	'DEF:ipReasmReqds=$database:ipReasmReqds:AVERAGE',
	'DEF:ipReasmOKs=$database:ipReasmOKs:AVERAGE',
	'DEF:ipReasmFails=$database:ipReasmFails:AVERAGE',
	'DEF:ipFragOKs=$database:ipFragOKs:AVERAGE',
	'DEF:ipFragFails=$database:ipFragFails:AVERAGE',
	'DEF:ipFragCreates=$database:ipFragCreates:AVERAGE',
	'DEF:ipInDelivers=$database:ipInDelivers:AVERAGE',

	'CDEF:ReasmReqds=ipReasmReqds,ipInDelivers,/,100,*',
	'CDEF:ReasmOKs=ipReasmOKs,ipInDelivers,/,100,*',
	'CDEF:ReasmFails=ipReasmFails,ipInDelivers,/,100,*',
	'CDEF:FragOKs=ipFragOKs,ipInDelivers,/,100,*',
	'CDEF:FragFails=ipFragFails,ipInDelivers,/,100,*',
	'CDEF:FragCreates=ipFragCreates,ipInDelivers,/,100,*',

	'LINE1:FragOKs#00ff00:Fragmentation OK',
	'GPRINT:FragOKs:AVERAGE:Avg FragOK %1.2lf %%\n',

	'LINE2:FragFails#ff0000:Fragmentation Fail',
	'GPRINT:FragFails:AVERAGE:Avg FragFail %1.2lf %%\n',

	'LINE1:ReasmOKs#0033aa:Reassembly OK',
	'GPRINT:ReasmOKs:AVERAGE:Avg ReasmOK %1.2lf %%\n',

	'LINE2:ReasmFails#000000:Reassembly Fail',
	'GPRINT:ReasmFails:AVERAGE:Avg ReasmFail %1.2lf %%\n',

	'GPRINT:ReasmReqds:AVERAGE:Avg ReasmReqd %1.2lf %%',
	'GPRINT:FragCreates:AVERAGE:Avg FragCreate %1.2lf %%\n',

	'COMMENT:Calculated as a % of ipInDelivers'
],
n

To make our graph ever more descriptive, we can add the maximum values just repeating the whole process again. Also it may need the small version of the graph. The final result should be like this:
%hash = (
	'title' => {
		'standard' => '$node - $length from $datestamp_start to $datestamp_end',
		'short' => '$node - $length'
	},
	'vlabel' => {
		'standard' => 'Fragmentation/Reassembly'
	},
	'option' => {
		'standard' => [
			'DEF:ipReasmReqds=$database:ipReasmReqds:AVERAGE',
			'DEF:ipReasmOKs=$database:ipReasmOKs:AVERAGE',
			'DEF:ipReasmFails=$database:ipReasmFails:AVERAGE',
			'DEF:ipFragOKs=$database:ipFragOKs:AVERAGE',
			'DEF:ipFragFails=$database:ipFragFails:AVERAGE',
			'DEF:ipFragCreates=$database:ipFragCreates:AVERAGE',
			'DEF:ipInDelivers=$database:ipInDelivers:AVERAGE',

			'DEF:MipReasmReqds=$database:ipReasmReqds:MAX',
			'DEF:MipReasmOKs=$database:ipReasmOKs:MAX',
			'DEF:MipReasmFails=$database:ipReasmFails:MAX',
			'DEF:MipFragOKs=$database:ipFragOKs:MAX',
			'DEF:MipFragFails=$database:ipFragFails:MAX',
			'DEF:MipFragCreates=$database:ipFragCreates:MAX',

			'CDEF:ReasmReqds=ipReasmReqds,ipInDelivers,/,100,*',
			'CDEF:ReasmOKs=ipReasmOKs,ipInDelivers,/,100,*',
			'CDEF:ReasmFails=ipReasmFails,ipInDelivers,/,100,*',
			'CDEF:FragOKs=ipFragOKs,ipInDelivers,/,100,*',
			'CDEF:FragFails=ipFragFails,ipInDelivers,/,100,*',
			'CDEF:FragCreates=ipFragCreates,ipInDelivers,/,100,*',

			'CDEF:MReasmReqds=MipReasmReqds,ipInDelivers,/,100,*',
			'CDEF:MReasmOKs=MipReasmOKs,ipInDelivers,/,100,*',
			'CDEF:MReasmFails=MipReasmFails,ipInDelivers,/,100,*',
			'CDEF:MFragOKs=MipFragOKs,ipInDelivers,/,100,*',
			'CDEF:MFragFails=MipFragFails,ipInDelivers,/,100,*',
			'CDEF:MFragCreates=MipFragCreates,ipInDelivers,/,100,*',

			'LINE1:FragOKs#00ff00:Fragmentation OK',
			'GPRINT:FragOKs:AVERAGE:Avg FragOK %1.2lf %%',
			'GPRINT:MFragOKs:MAX:Max FragOK %1.2lf %%\n',

			'LINE2:FragFails#ff0000:Fragmentation Fail',
			'GPRINT:FragFails:AVERAGE:Avg FragFail %1.2lf %%',
			'GPRINT:MFragFails:MAX:Max FragFail %1.2lf %%\n',

			'LINE1:ReasmOKs#0033aa:Reassembly OK',
			'GPRINT:ReasmOKs:AVERAGE:Avg ReasmOK %1.2lf %%',
			'GPRINT:MReasmOKs:MAX:Max ReasmOK %1.2lf %%\n',

			'LINE2:ReasmFails#000000:Reassembly Fail',
			'GPRINT:ReasmFails:AVERAGE:Avg ReasmFail %1.2lf %%',
			'GPRINT:MReasmFails:MAX:Max ReasmFail %1.2lf %%\n',

			'GPRINT:ReasmReqds:AVERAGE:Avg ReasmReqd %1.2lf %%',
			'GPRINT:MReasmReqds:MAX:Max ReasmReqd %1.2lf %%\n',

			'GPRINT:FragCreates:AVERAGE:Avg FragCreate %1.2lf %%',
			'GPRINT:MFragCreates:MAX:Max FragCreate %1.2lf %%\n',

			'COMMENT:Calculated as a % of ipInDelivers'
		],
		'small' => [
			'DEF:ipReasmOKs=$database:ipReasmOKs:AVERAGE',
			'DEF:ipReasmFails=$database:ipReasmFails:AVERAGE',
			'DEF:ipFragOKs=$database:ipFragOKs:AVERAGE',
			'DEF:ipFragFails=$database:ipFragFails:AVERAGE',
			'DEF:ipInDelivers=$database:ipInDelivers:AVERAGE',
			'CDEF:ReasmOKs=ipReasmOKs,ipInDelivers,/,100,*',
			'CDEF:ReasmFails=ipReasmFails,ipInDelivers,/,100,*',
			'CDEF:FragOKs=ipFragOKs,ipInDelivers,/,100,*',
			'CDEF:FragFails=ipFragFails,ipInDelivers,/,100,*',
			'LINE1:FragOKs#00ff00: Fragmentation OK',
			'LINE2:FragFails#ff0000: Fragmentation Fail',
			'LINE1:ReasmOKs#0033aa: Reassembly OK',
			'LINE2:ReasmFails#000000: Reassembly Fail',
			'COMMENT:   Calculated as a % of ipInDelivers'
		]
	}
);

END