Introduction
NMIS8 is a powerful network management system which performs Windows and Unix server monitoring out of the box. NMIS8 supports Windows servers as well as the popular NET-SNMP SNMP daemon, which is widely used on Linux and other Unix systems. The core of NMIS server management is the Host Resources MIB, which is standardised in RFC2790, both the NET-SNMP, Windows SNMP and VMware ESXi daemons implement the Host Resources MIB.
NMIS8 has capabilities for performance and fault management of servers as well as service (application) monitoring running on servers.
NMIS8 collects and stores the following performance data from servers:
- Processor load
- Physical memory usage (not currently available from VMware ESXi)
- Virtual memory usage (not currently available from VMware ESXi)
- Disk usage (capacity and used)
- Network interface usage
Service Monitoring
- Checks Host Resources MIB for service status
- Performs poll of TCP/UDP port
- Runs send/expect scripts which return status (can perform full transaction over system and is highly extensible)
- Run external programs which return status (and optionally extra values)
You can download NMIS from the Opmantek webpage.
Windows Server Support
Depends on Windows SNMP Service (often referred to as agentless server monitoring). NMIS will collect the following information from Windows Servers in addition to the already described information.
- IP Utilisation
- Server Memory Pages per Sec
- CPU Interrupts
- Memory Stats (commited and available bytes)
- Number of Users
All of these information requires no Agent to be installed onto the Windows server other than the freely available Windows SNMP Service (part of the Windows installation and setup).
Unix Server Support
Depends on NET-SNMP daemon being installed and configured, usually installed by default on most Unix platforms. Instructions for installing the NET-SNMP daemon are included in the NMIS 8 Installation Guide.
Configuring NMIS to Monitor Services
An updated services file "Services.nmis" was distributed with later NMIS8 versions, and is attached to this page Services.nmis, this is compatible with earlier versions of NMIS8. This file includes definitions for using the script method to poll HTTP, as well as monitoring for a MySQL daemon, and various ports using NMAP connections. Once Services.nmis is copied to /usr/local/nmis8/conf, you should verify that you have the scripts folder in nmis8, this is included in the install directory "cp -r /usr/local/nmis8/install/scripts /usr/local/nmis8/conf" will make that happen.
When a service "outage" is detected you will receive NMIS events and notifications if NMIS has been configured to do so.
Step 1
From the NMIS Menu, navigate to "System -> System Configuration -> Nodes (devices)"

Step 2
From the list of nodes, select "edit" from the server you want to monitor services on.

Step 3
From the services box, select the services you want to monitor, you can select several services.

Step 4
When you are done, select "Edit and Update Node", after the next poll cycle runs, within about 5 minutes you will see that the services are now being monitored

Step 5
You can also now select "Services" from the node menu bar and see a graph of all the monitored services.

From version 8.4.10G onwards the service graphs also include the response time (as number and and graph) which is the elapsed time of the service test.
Defining new SNMP based Services to Monitor
This is how to define a new services based on using SNMP for the status of the service.
Step 1
Determine the name of the service you want to monitor, for example to Monitor MongoDB on Windows, the process name is mongod.exe.
Step 2
From the NMIS Menu, navigate to "System -> System Configuration -> Services"

Step 3
Then select add or edit to add a new service or edit an existing service monitoring definition.

Step 4
Give the service a name, for Windows we call them service and for Unix we call them daemons. Select the Service Type of service which is an SNMP monitored service.

Step 5
Click "Add" or "Edit" to save the new service and then you can assign this to a device as described above in "Configuring NMIS Services to Monitor".
Defining new Script based Services to Monitor
This is how to define a new services based on using a sapi script to connect to the socket and send some data, looking for the correct response.
Sapi scripts are extremely similar to expect scripts and documented at the end of /usr/local/nmis8/lib/sapi.pm.
Step 1
Determine the name of the service you want to monitor, for example to is the NMIS web application running.
Step 2 and Step 3
Same as above,
From the NMIS Menu, navigate to "System -> System Configuration -> Services"
Then select add or edit to add a new service or edit an existing service monitoring definition.
Step 4
Give the service a name, in this example nmis, and it is a script and define the port it will be here port 80.
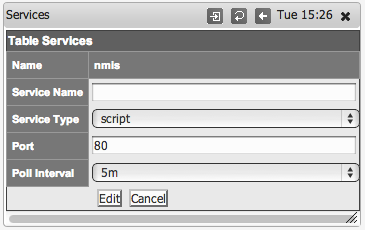
Step 5
Create a script which will get to the appropriate WEB Application URL, use the basic http service as a basis, the name of the service will be the name of the script
cp /usr/local/nmis8/conf/scripts/http /usr/local/nmis8/conf/scripts/nmis
Then edit that script and change the script to get your URL correctly, in this example the final nmis script looked like this:
send: HEAD /nmis8/ HTTP/1.0
send:
expect: 200 OK
So this script will connect to port 80, send the "HEAD /nmis8/ HTTP/1.0" and a newline, the most basic if HTTP Headers, the response it would get would be:
HTTP/1.1 200 OK
Date: Tue, 01 Apr 2014 05:19:19 GMT
Server: Apache/2.2.15 (CentOS)
Last-Modified: Thu, 21 Mar 2013 05:14:21 GMT
ETag: "a233b-67c-4d8686950cd27"
Accept-Ranges: bytes
Content-Length: 1660
Vary: Accept-Encoding
Connection: close
Content-Type: text/html; charset=UTF-8
The expect would match the data "200 OK" and declare success. More complex requests could be made here. E.g. checking a database status using HTTP.
Monitoring Services with external programs
Since version 8.4.10G nmis can also run external programs of your choice to test service statuses. To interoperate with NMIS such a program must conform to a few simple rules which are described below.
The dialog for Adding or Editing Services now shows some extra options:
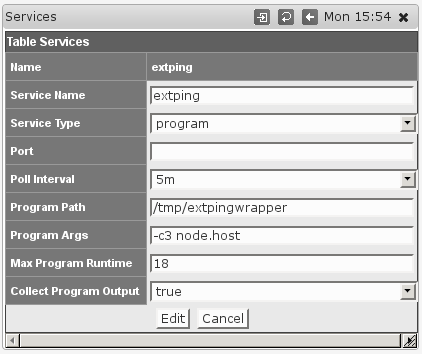
Chooising the Service Type program activates the options for running external programs; they are ignored for all other Service Types.
- Program Path must point to the program in question, and must be an absolute path (i.e. starting with
/). This setting is clearly mandatory, and the program in question must be directly executable by thenmisuser. - Program Args defines arguments that are to be given to this program when run. This is an optional setting.
Any tokens of the formnode.something will be replaced by the corresponding property of this node; most likely you will want to usenode.hostfor the node's dns name or network address,node.namefor the logical node name, maybe evennode.sysContact. To determine the available properties check the 'system' section of/usr/local/nmis8/var/yournode-node.nmis. - Max Program Runtime sets the upper limit (in seconds) for how long NMIS will wait for this program to complete.
If the program has not finished by that time then it's terminated forcibly and the service is marked 'down'. This setting is optional, but highly recommended - if you don't set a limit then a single uncooperative external program could delay all NMIS collect or update operations indefinitely! - Collect Program Output defines whether extra output by the program is to be collected and stored, or ignored.
The external program must follow these interfacing rules to work with NMIS:
- Your external program must report the service status by returning an exit code between 0 and 100 inclusive.
0 means the services is down, any other value NMIS interprets as service is up. The service graphs do show the precise value, however. - Your external program can't read from stdin, and needs to finish its work and terminate as quickly as feasible; NMIS cannot proceed with further operations until the external program terminates.
- Your external program may report back to NMIS by printing
key=valuepairs on stdout, one pair per line.
If the Collect Program Output option is enabled, then NMIS will collect these values and store them in the RRD database and the node file.
The keyresponsetimeis special: any numeric value given for it will be used directly in the service and service response time graphs.