Beta
This feature is in beta and can change at any time. This feature should be used in non production environments. In due course this will replace Business Services.
To enable Enterprise Services add this to opCommon.json and restart the omkd daemon.
"beta":{ "opcharts_enterprise_services": "true" },
# execute these two commands:sudo /usr/local/omk/bin/patch_config.exe /usr/local/omk/conf/opCommon.json /beta/opcharts_enterprise_services=truesudo service omkd restart
Overview
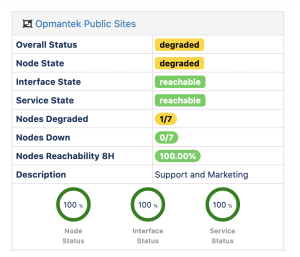
Enterprise Services display interface status panels and node status panels in a single page. This allows grouping related interfaces/nodes together to have a single location that a user can see these related items.
Enterprise Services are supported under the MSP authorization system when added as a dashboard component, RBAC for enterprise services is still being worked on.
How metrics are calculated
Nodes
Node status is calculated from the status events for the node, it aggregates the status event levels and averages out the current status.
If any node is unreachable the enterprise service is marked unreachable, if nodes are degraded but none are unreachable the enterprise service is marked degraded.
Interfaces
Interfaces down metrics are calculated by getting all interface inventory with the status "Interface Down", and store a count of these interfaces.
The overall interface status is calculated from all interfaces related status level and averaged out.
If any interface is marked "Interface Down" the enterprise service is marked unreachable.
Monitored Services
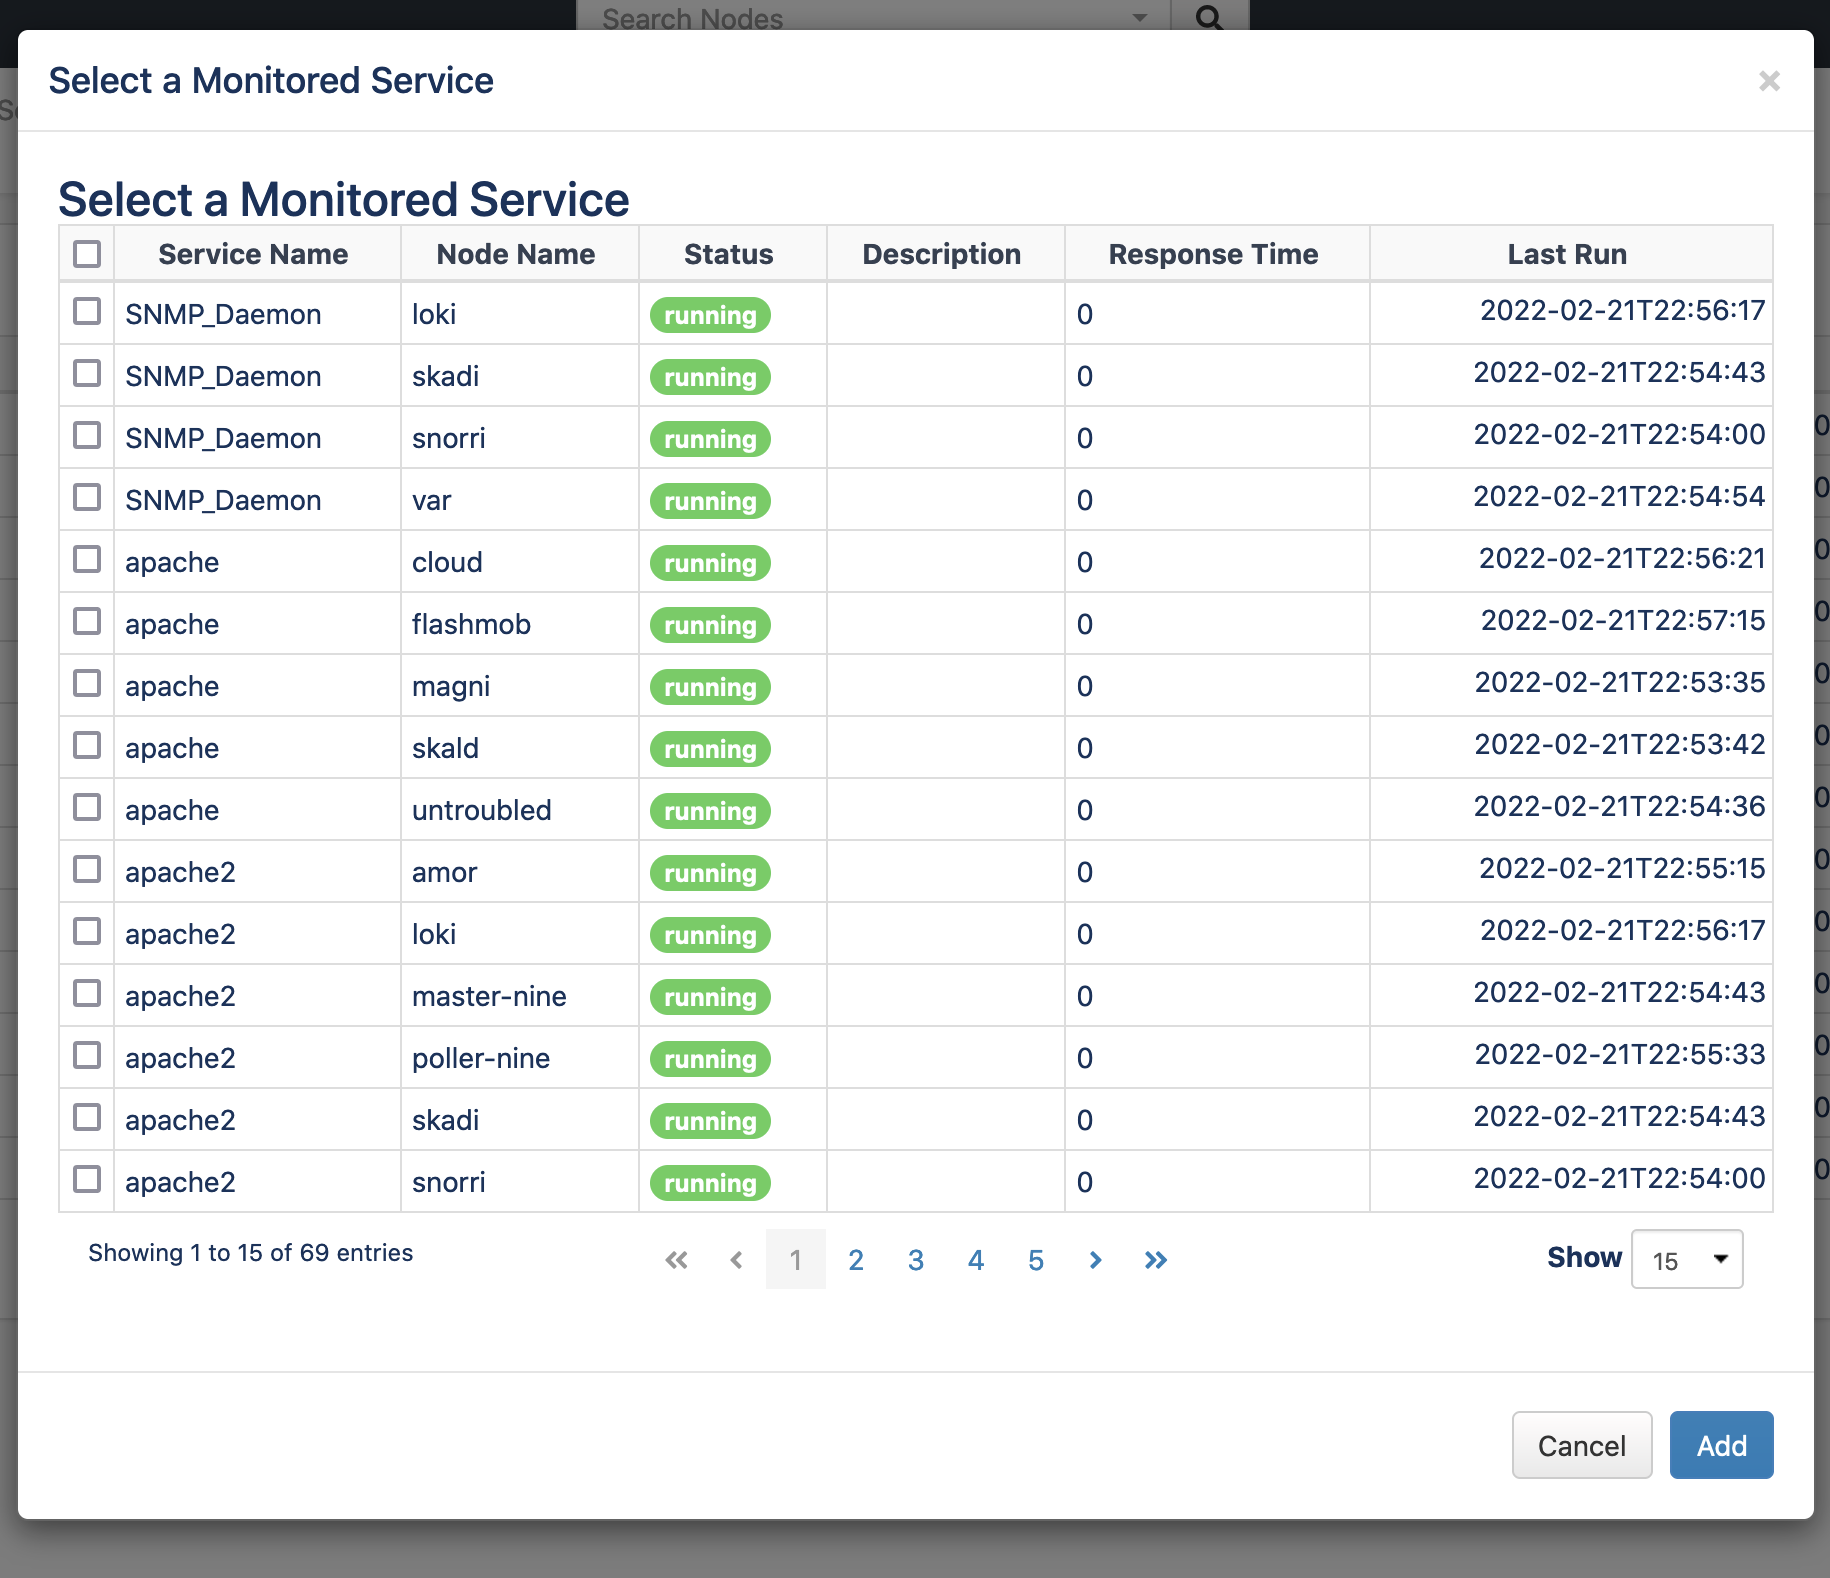
All service inventory tagged with the enterprise service name is aggerated to get the current status. If any monitored service is marked down then enterprise service is marked unreachable.
Overall Status
Overall Status can be Up, Degraded or Down UP , DEGRADED , DOWN
The overall state of the enterprise service is calculated from the worst state of each one of the services.
| Monitored Services | Nodes | Interfaces |
|---|---|---|
| Services Fatal | Nodes Unreachable | Interfaces Down |
| Services Degraded | Nodes Degraded | Interfaces Up |
| Services Up | Node Up | |
| Status | Status | Status |
Enterprise Service Rules
Enterprise service rules calculate how each group of entities control the status of the service.
The rules set out levels on how each component should degraded based on the status level, its set as an array of Level Type and Level
so Normal, 100, Degraded, 90
would mean a status of 99 would be reachable but a status of 89 would be degraded, you can use this to tune alerts.
Any Level Type not Normal put raise a proactive enterprise alert for this service.
New/Edit
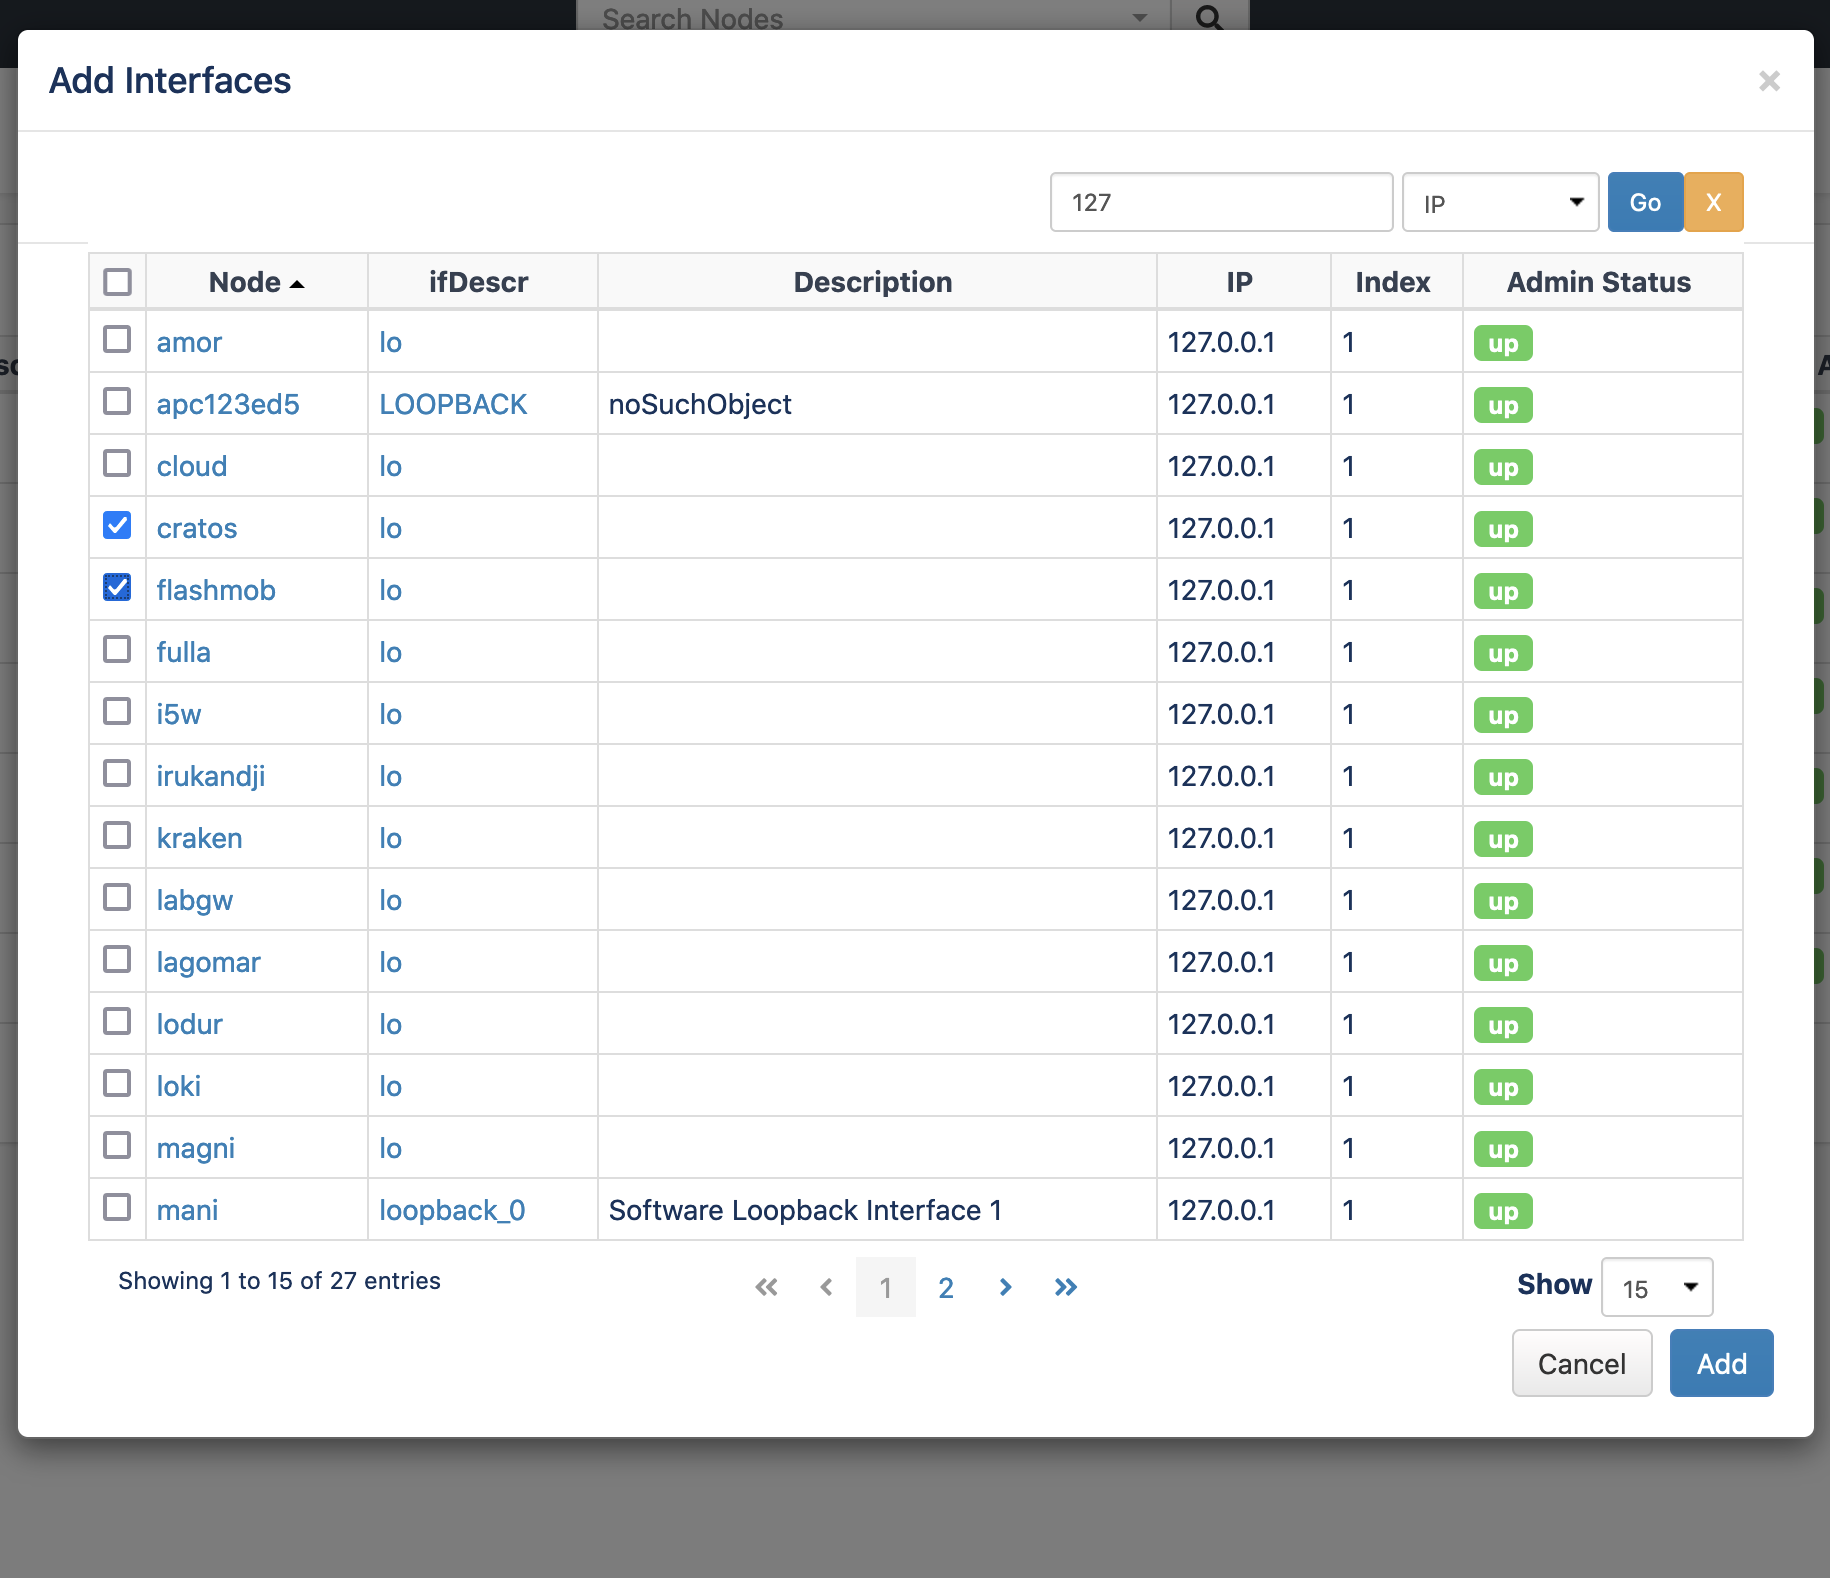
Add an Interface
To add a new interface, press the "+" icon in the Interfaces section as shown in the screen shot above. Enter or select the node name, select the interface index/name and press "Add".
Add a Node
Adding a Node is similar, press the "+" icon in the Nodes section. Enter the node name and press the "Add" button, a node panel for the selected node should now be displayed.

Add a Monitored Service
Remove an Interface, Node or Service
To remove either, press the "x" icon near the top right of the panel and it will be removed from the document. Save the document to accept your changes.