Overview
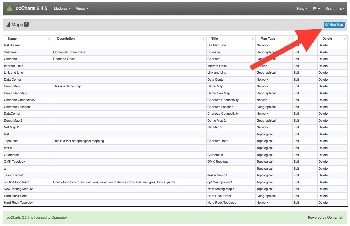
The Geographical Maps style Map allows the user to create live geographical maps based on the Google Maps API. A menu listing of all available Maps can be accessed by selecting Views -> Maps from the opCharts menu bar.
Creating a New Geographical Map
1. A Geographical Map must be created before it can be used or added to a Dashboard. To create a new Map, Click the New Map from the Maps screen (Views -> Maps).
2. Next, select Geographical Map from the Map Type drop-down located in the top-left corner.
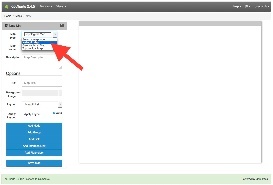
3. Assign your Geographical Map a Map Name - This must be unique; no 2 maps can have the same Map Name.
4. You can also provide a Description of your Map. This will be displayed on the Maps View page, and also when adding a Map to a Dashboard.
Options
Title - This is what will be displayed in the Component window's title bar.
Background Image - Disabled for Geographical Map style Maps
Layout - Disabled for Geographical Map style Maps
Apply Layout - Disabled for Geographical Map style Maps
Auto checkbox - Disabled for Geographical Map style Maps
Add Node
The Add Node button allows you to add an individual Node to the Map. The Display Name, Icon, and Link to Map fields have no effect in a Geological Map.
Once the node is added it may be moved around the Map by left-clicking and dragging it to position.
Add Group
The Add Group button allows you to add an icon representing a Group of Nodes to the Map. When clicked this will display the averaged health of all Nodes within the Group. The Display Name field has no effect in a Geological Map.
Add Link
The Add Link button adds a physical connecting line between 2 Nodes or 2 Groups. You can assign the Link a Link Name, which will be displayed within a bordered box at the center point of the line between the 2 Nodes.These liks are convenient was to show relationships between components, without linking those relationships to specific interfaces or data patterns.

Add Interface Link
The Add Interface Link button allows you to add an interactive Link representing a interface's flow traffic between 2 Node or Group icons. Select your Link Source, the Node providing the Interface, the specific Interface that handles the link, and the Link Destination.

The resulting link will be anchored to the 2 Nodes/Groups and display both the inbound and outbound link speeds as a percentage of the available interface speed. The link is also hinged in the middle, allowing some modicum of adjustment for background artwork and readability.

Add Placeholder
The Add Placeholder button allows you to add an icon to the Network Map that is not linked to a specific Node or Group. Similar to both Nodes and Groups you can assign a Display Name, select a Display Icon, and Link the icon to another Dashboard.
Editing Nodes in the Network Map
Nodes on the Network Map can be edited. Simply return to edit mode (open the Map by selecting Edit from the Map view or by clicking the Edit button in the top-right corner of the Component window) then RIGHT-click on the Node you want to edit, select Edit from the pop-up menu.
