Overview
Components are the building blocks of opCharts' dashboards, as well as the TopN view. Components are individual graphical views into the time related data NMIS is capturing and evaluating.; including both numerical and textual (IE syslog information) type data.
Differences in Components
The are four basic Components available in opCharts. These are:
- NMIS Chart; these are the predefined charts available natively inside NMIS. They can only be used as-is and cannot be customized.
- Maps; these include network diagrams, Google geographic maps, and dynamically produced topological diagrams
- opCharts Chart; These are custom charts built using any data sets within Opmantek's suite of tools
- Custom SQL Generated Chart (see: Creating a SQL Chart)
The Component Window:
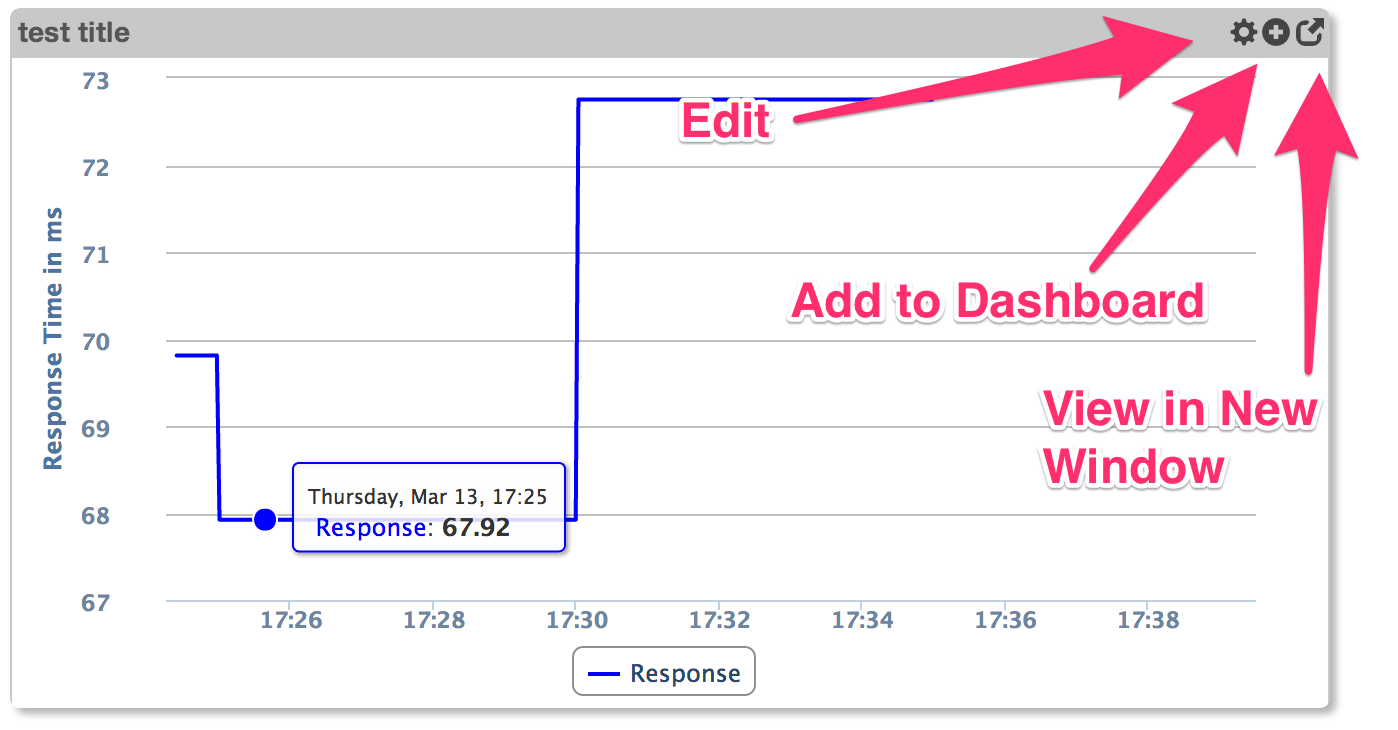
Edit:
This button will appear when viewing a chart that has been saved. If this chart is auto-generated by opCharts then the button will not appear. If you want to save this chart the fastest way is to press the "+" sign, which will save the chart and open a new dashboard to save it into (you don't have to save the new dashboard, hit back and refresh and the edit button will appear)
Add to Dashboard:
Pressing this button presents a form with the option to select which dashboard to add the chart to, the option to name the chart (if the name already exists, whatever chart is using that name will be used, if a unique name is used the current chart will be saved under that name when Add is clicked). After add is clicked a the requested dashboard is displayed and the chart is placed in the first empty component found. If no empty components are found it will replace the last entry.
View in New Window:
This button will open the chart in full-screen mode. This option is only present if the chart has been saved (just like edit).