Compatible with NMIS9
Tabled of Contents
Introduction
NMIS8 is a powerful network management system, but NMIS is not only a network management system: it performs Windows and Unix server monitoring out of the box if your server supports SNMP. NMIS8 works well with Windows servers and especially with the popular NET-SNMP SNMP daemon, which is widely used on Linux and other Unix systems.
The core of NMIS server management is the Host Resources MIB, which is standardised in RFC2790, both the NET-SNMP, Windows SNMP and VMware ESXi daemons implement the Host Resources MIB. But NMIS is not relying on SNMP exclusively; it has capabilities for performance and fault management of servers, as well as service (application) monitoring running on servers.
This document describes a few common approaches towards service monitoring with or without using SNMP; There is a companion document named Service Monitoring Examples which shows a number of practical example service monitoring setups.
NMIS8 collects and stores the following performance data from servers:
- Processor load
- Physical memory usage (not currently available from VMware ESXi)
- Virtual memory usage (not currently available from VMware ESXi)
- Disk usage (capacity and used)
- Network interface usage
Service Monitoring
- Checks Host Resources MIB for service status
- Performs poll of TCP/UDP port
- Runs send/expect scripts which return status (can perform full transaction over system and is highly extensible)
- Run external programs which return status (and optionally extra values)
You can download NMIS from the Opmantek webpage.
Windows Server Support
Depends on Windows SNMP Service (often referred to as agentless server monitoring). NMIS will collect the following information from Windows Servers in addition to the already described information.
- IP Utilisation
- Server Memory Pages per Sec
- CPU Interrupts
- Memory Stats (commited and available bytes)
- Number of Users
All of these information requires no Agent to be installed onto the Windows server other than the freely available Windows SNMP Service (part of the Windows installation and setup).
For more details about installing the SNMP Service on Windows, please see the following:
- Enabling SNMP Management on Windows 2008 Server
- HOW TO: Configure the Simple Network Management Protocol (SNMP) Service in Windows Server 2003
- TechNet: How to Install SNMP Remotely
Unix Server Support
Depends on NET-SNMP daemon being installed and configured, usually installed by default on most Unix platforms. Instructions for installing the NET-SNMP daemon are included in the NMIS 8 Installation Guide (up to Version 8.5.4G).
Quickstart Chart of a Service Definition
| Parameter Name | Relevant for which Service Type | Description |
|---|---|---|
| Name | all | Every service definition must have a unique service name. In NMIS versions before 8.6.2 this also sets the script name for type script. |
| Service_Type | all | Every service must specify the type of check to perform. |
| Description | all | optional, free from text |
| Service_Name | service, |
|
| Service_Parameters | service | Regular expression to match by executable path and process arguments |
| Poll_Interval | all except service | SNMP-based services are only checked during a type=collect poll cycle |
| Port | port and | port: The TCP or UDP Port number to perform a connect check on.script: The TCP port to perform scripted communication on on. |
| Program | program and nagios-plugin | The external program or plugin that performs the actual service test |
| Args | program and nagios-plugin | The arguments for that external program |
| Max_Runtime | program and nagios-plugin | How long to let that program run at most |
| Collect_Output | program and nagios-plugin | Whether the program output should be collected and stored |
Configuring NMIS to Monitor Services - Step By Step
An updated services file "Services.nmis" was distributed with later NMIS8 versions, and is attached to this page Services.nmis, this is compatible with earlier versions of NMIS8. This file includes definitions for using the script method to poll HTTP, as well as monitoring for a MySQL daemon, and various ports using NMAP connections. Once Services.nmis is copied to /usr/local/nmis8/conf, you should verify that you have the scripts folder in nmis8, this is included in the install directory. Running cp -r /usr/local/nmis8/install/scripts /usr/local/nmis8/conf will ensure the service definition files are available.
When a service "outage" is detected you will receive NMIS events and notifications if NMIS has been configured to do so.
Step 1
From the NMIS Menu, navigate to "System -> System Configuration -> Nodes (devices)"

Step 2
From the list of nodes, select "edit" from the server you want to monitor services on.

Step 3
From the services box, select the services you want to monitor, you can select several services.

Step 4
When you are done, select "Edit and Update Node", after the next poll cycle runs, within about 5 minutes you will see that the services are now being monitored

Step 5
You can also now select "Services" from the node menu bar and see a graph of all the monitored services.

Starting with version 8.4.10G the service graphs also include the response time (as number and and graph) which is the elapsed time of the service test.
Defining new SNMP based Services to Monitor
This is how to define a new services based on using SNMP for the status of the service.
This feature requires the device to support the HOST-RESOURCES-MIB, and specifically the hrSWRun instrumentation which provides "The (conceptual) table of software running on the host."
Step 1
Determine the name of the service process you want to monitor, for example to Monitor MongoDB on Windows, the process name is mongod.exe. As the MongoDB server state is reported as an attribute for the named process, you'll have to tell NMIS what process to look for.
Step 2
From the NMIS Menu, navigate to "System -> System Configuration -> Services"

Step 3
Then select add or edit to add a new service or edit an existing service monitoring definition.

Step 4
Give the service a (display) name, for Windows we call them service and for Unix we call them daemons. Insert the appropriate process name in the Service Name field, and select the Service Type service to tell NMIS that this is an SNMP-monitored service.

Step 5
Click "Add" or "Edit" to save the new service and then you can assign this to a device as described above in "Configuring NMIS Services to Monitor".
Process Selection Details
In NMIS 8.6 we refined the process selection mechanism to improve its flexibility, and you can now check more of the process properties reported by SNMP.
(Up to Version 8.5.12G only Service Name is matched against the Process Name).
- Your given "Service Name" is used (as regular expression) to check the Process Name,
- and your given "Service Parameters" value is used (again as regular expression) to check the Process Path and Process Arguments.
You have to provide at least one of the two, and a blank value will be interpreted as 'match anything'.
Note that the Service Name regular expression cannot contain the anchors "^" or "$", whereas the Service Parameters one can.
For example, if you want to check a particular Java application, you would set the Service Name to java and the Service Parameters to some identifying property for this particular application. To figure out what exactly might distinguish this application from others, have a look at the Service List page for that node, and the Service and Parameters columns in particular:
| Service | Parameters |
|---|---|
| java | -Djava.util.logging.config.file=/opt/confluence/conf/logging.properties -Xms512m -Xmx768m -XX:MaxPermSize=512m -Djava.awt.headle |
| mingetty | /sbin/mingetty /dev/tty2 |
In this example, the Java process happens to be the one for the Confluence application, and the mingetty is the one covering the second terminal.
The following simple configuration would match just those two processes:
  'confluence' => {
    'Name' => 'confluence',
    'Service_Type' => 'service',
    'Poll_Interval' => '5m',
    'Service_Name' => 'java',
    'Service_Parameters' => '/opt/confluence',
  },
  'secondterminal' => {
    'Name' => 'secondterminal',
    'Service_Type' => 'service',
    'Poll_Interval' => '5m',
    'Service_Name' => '(min|a)getty',
    'Service_Parameters' => 'tty2',
  },
You can also be more specific or loose if needed, as both Service Name and Parameters allow regular expressions: The example above will also accept "agetty" processes serving the second terminal.
Defining new TCP or UDP Ports to Monitor
Assuming you only want to check if a server listens for network connections on a particular TCP or UDP port (without actually exchanging application-level data with that service), then this is how to instruct NMIS to do that:
- Select Service Type
port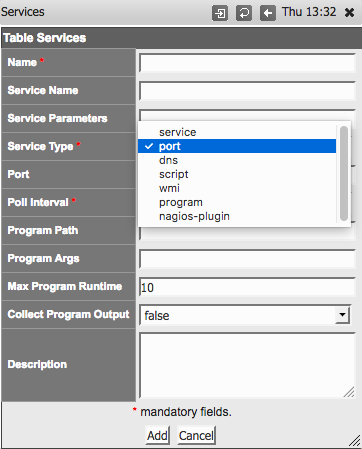
- Give the appropriate port and protocol in the form of
udp:123(that would be NTP) ortcp:22(that's SSH) - Ignore Service Name and all program-related settings
Please note that the open/reachable/closed status for UDP ports is unreliable due to the nature of the protocol; doing end-to-end service-specific tests is recommended for UDP.
Defining DNS Server Monitoring
NMIS also supports monitoring of DNS servers out of the box:
- Service Type is
dns. - Up to version 8.4.10G inclusive, the builtin dns monitor requires the node's Name/IP Address setting to hold the node's fully qualified domain name. NMIS then requests DNS info for this FQDN from the node that is marked for dns service monitoring. The Service Name is ignored.
- After version 8.4.10G, you must specify the DNS query target as the Service Name. This can be either an IP address or a fully qualified domain name (host or domain). Again it is the node marked for dns monitoring that is asked for DNS info, but you've got control over what is requested.
Defining new (sapi-)Script based Services to Monitor
This is how to define a new services based on using a sapi script to connect to the socket and send some data, looking for the correct response.
Please note that this service type does not cover scripts written in a general-purpose programming language (e.g. perl, python, php): use Service Type program for those.
Sapi scripts are extremely similar to expect scripts and documented at the end of /usr/local/nmis8/lib/sapi.pm; they're very simple but also quite limited capability-wise.
Step 1
Determine the name of the service you want to monitor.
In the example below we call the service "nmis" and we check that the NMIS web application is running and answering.
Note that the script file must be named the same as the Name given to the service.
Step 2 and Step 3
Same as above,
From the NMIS Menu, navigate to "System -> System Configuration -> Services"
Then select add or edit to add a new service or edit an existing service monitoring definition.
Step 4
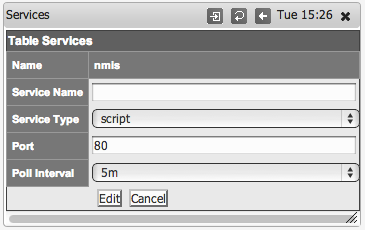
Give the service a name, in this example "nmis", and declare it to be of type script and define the port - here port 80.
In NMIS 8.6.2 and newer you must set the script name in the "Service Name" property; in versions before that the "Name" also controlled the script name.
Step 5
Create a script which will get to the appropriate WEB Application URL, use the basic http service as a basis. The name of the service must be the same as the name of the script before version 8.6.2; from 8.6.2 onwards it must match the "Service Name" property.
cp /usr/local/nmis8/conf/scripts/http /usr/local/nmis8/conf/scripts/nmis
Then edit that script and change the script to get your URL correctly, in this example the final nmis script looked like this:
send: HEAD /nmis8/ HTTP/1.0
send:
expect: 200 OK
So this script will connect to port 80, send the "HEAD /nmis8/ HTTP/1.0" and a newline, the most basic of HTTP Headers, the response it would get would be:
HTTP/1.1 200 OK
Date: Tue, 01 Apr 2014 05:19:19 GMT
Server: Apache/2.2.15 (CentOS)
Last-Modified: Thu, 21 Mar 2013 05:14:21 GMT
ETag: "a233b-67c-4d8686950cd27"
Accept-Ranges: bytes
Content-Length: 1660
Vary: Accept-Encoding
Connection: close
Content-Type: text/html; charset=UTF-8
The expect would match the data "200 OK" and declare success. More complex requests could be made here. E.g. checking a database status using HTTP.
Monitoring Services with external programs
Starting with version 8.4.10G nmis can also run external programs to test a service status. To interoperate with NMIS such a program must conform to a few simple rules which are described below.
The steps for enabling this facility are mostly the same as for the other service types, except for the service definition of course. The dialog for Adding or Editing Services now shows some extra options:
Choosing the Service Type program activates the options for running external programs; they are ignored for all other Service Types.
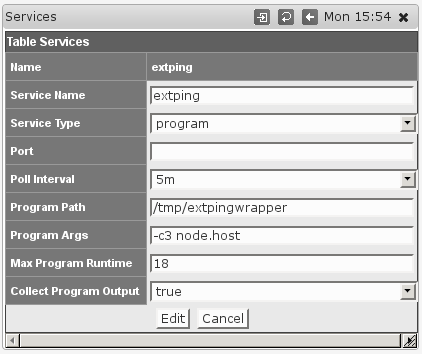
- Program Path must point to the program in question, and must be an absolute path (i.e. starting with
/). This setting is clearly mandatory, and the program in question must be directly executable by thenmisuser. - Program Args defines arguments that are to be given to this program when run. This is an optional setting.
Any tokens of the form"node.something" will be replaced by the corresponding property of this node; most likely you will want to usenode.hostfor the node's dns name or network address,node.namefor the logical node name, maybe evennode.sysContact. To determine the available properties check the 'system' section of/usr/local/nmis8/var/yournode-node.nmis(or .json). - Max Program Runtime sets the upper limit (in seconds) for how long NMIS will wait for this program to complete.
If the program has not finished by that time then it's terminated forcibly and the service is marked 'down'. This setting is optional, but highly recommended - if you don't set a limit then a single uncooperative external program could delay all NMIS collect or update operations indefinitely! - Collect Program Output defines whether extra output by the program is to be collected and stored, or ignored.
The external program must follow these interfacing rules to work with NMIS:
- Your external program must report the service status by returning an exit code between 0 and 100 inclusive.
0 means the services is down, 100 means the service is considered up and running perfectly, and values inbetween is interpreted as up-but-degraded. The service graphs do show the precise value.
New in NMIS 8.5.10: NMIS now distinguishes degraded services properly, shows them in a different color than up services and creates "Service Degraded" events (not just "Service Down"). - Your external program can't read from stdin, and needs to finish its work and terminate as quickly as feasible; NMIS cannot proceed with further operations until the external program terminates.
- New in NMIS 8.5.10: Your external program may provide a textual service status as the first line of output, which NMIS captures (if "Collect Program Output" is enabled), displays and includes in any events.
Such a textual service status is also displayed when the service is up. If you would like to record custom numeric values from your service as described below your script must first return some text status, it should only then return the key=value as below. - Your external program may report numeric values back to NMIS by printing
key=valuepairs on stdout, one pair per line.
If the Collect Program Output option is enabled, then NMIS will collect these values and store them in the RRD database and the node file. Note you must first return a status string as above, only the subsequent lines of output will be interpreted as numeric values for "Custom Measurements"
The keyresponsetimeis special: any numeric value given for it will be used directly in the service and service response time graphs.
Please note that NMIS is somewhat picky where file permissions are concerned. With the default configuration it controls all files under /usr/local/nmis8 and it will strip the execute permissions from all files not named something.sh or something.pl. This clearly affects the acceptable names for your external programs if you want to save them anywhere within the NMIS dir.
A simple adjustment can be made to relax this strictness:
'nmis_executable' => '(/(bin|admin)/[a-zA-Z0-9_\\.-]+|\\.pl|\\.sh)$',
Setting the Config.nmis option nmis_executable to the above would instruct NMIS to treat all files in /usr/local/nmis8/bin and and /admin, as well as any .pl and .sh files as executables.
Monitoing services with an external program in this fashion is easy to implement, but slightly limited in functionality; if you require access to all the advanced event management and alerting features of NMIS for a service then we recommend that you extend your snmpd for this service instead of using the external program facility.
Using Nagios Plugins for service monitoring (new in NMIS 8.5.10)
Starting with NMIS 8.5.10 a new service type nagios-plugin is available. All options described for "external programs" above apply unchanged, and the "Program Path" has to point to the Nagios plugin that you'd like to make use of. (There are two well-known sites that collect Nagios plugins, https://www.monitoring-plugins.org/ and http://nagios-plugins.org/.)
NMIS interprets the Nagios states OK as "service up/100", Warning as "degraded/50" and states Critical and Unknown as "down/0".
At this time Nagios' optional "unit of measure" and "min/max/warning level" returns are ignored. Any "performance data" (as Nagios calls extra numeric service status data) that your plugin might return is collected if the "Collect Program Output" option is active.
New service monitoring displays in NMIS 8.5.10
NMIS 8.5.10 adds new screens for service overview and service details.
The overview screen listing all monitored services is reached via "Monitored Services" in the "Service Desk" or "Network Status" menus.
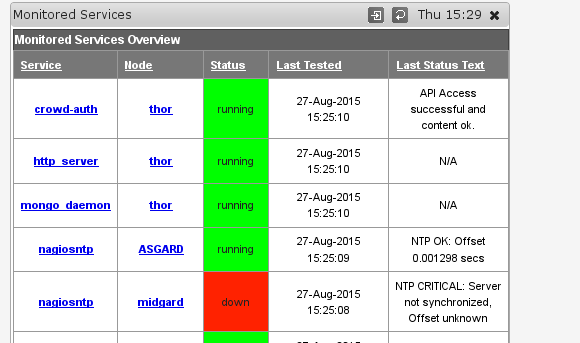
As you can see three of the five services shown do make use of the new status text collection (for Service Types "program" and "nagios-plugin").
Clicking on any of the "Service" links brings up the service detail page for this service on this node. (The same details page is also reachable from a node's "services" tab and from its main node details screen.)

As you can see this service also collects extra metrics, in this case "offset". The graph is clickable, as are the two status and response time columns; all send you to the well-known "graph drill-in" page.
Custom Graphs for Services (new in NMIS 8.5.10)
If your monitored service is program or nagios-plugin based, then you may want to collect and graph extra numeric data (what Nagios calls "performance data"). Collection and RRD-storage has been possible since 8.4.10G, but support for comfortably making and displaying custom graphs is new.
NMIS 8.5.10 provides a new helper program, ./admin/service_graph_helper.pl which guides you interactively through the process of selecting a service, its (standard or custom) measurements you'd like to graph, what graph styles you'd like them to have (line or just textual prints) and colors. This tool is menu-based and results in nice custom graph definitions for NMIS.
The new service details view now displays any custom graphs that might be available for a particular service, like in the example screenshot below:
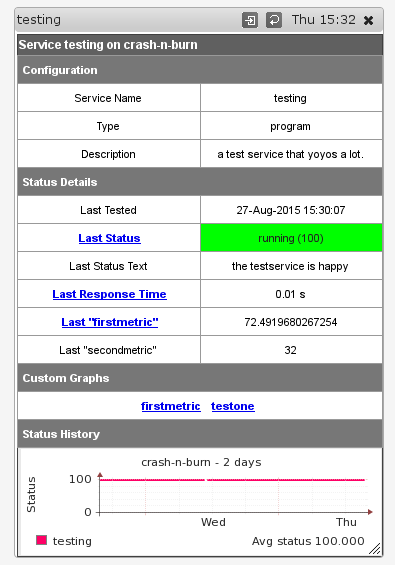
In this example, a custom graph for just the "firstmetric" extra mesurement was created which is accessible both via the "Last firstmetric" column as well as the list of custom graphs below. The other custom graph, "testone", displays more than one measurement.
8 Comments
Josh Atterbury
Hi Keith,
I noticed that within the GUI under Service Type the option "wmi" exists. I couldn't find any howto info on this so checked the source code and can't see "wmi" mentioned under the services portion of nmis.pl. The wmi entry appears to be only in the services table.
Is this a future capability that shouldn't be displayed at the moment?
Keith Sinclair
Josh, That comes from the Table definition in conf/Table-Services.nmis,
{ 'Service_Type' => { header => 'Service Type',display => 'header,popup', value => [ 'service', "port", "dns", 'script', 'wmi' ] }},
We would like to add some WMI support into NMIS, but no one has requested it, so this is a placeholder for one type of WMI support.
Are you after WMI support?
Gregory Paulino
How do I monitor CPU and memory utlization in HP UX? They are not listed in the server elegible graph types.
Alexander Zangerl
You'd use the HP-UX-builtin snmp agent, or the Net-SNMP snmpd which natively exposes cpu and memory info. The service monitoring defined on this page applies primarily to things not handled by a platform's snmp agent.
see also https://administratosphere.wordpress.com/2009/06/09/using-net-snmp-and-hp-ux-snmp-together/.
Gregory Paulino
Hi Alex, thanks for your response, I'll try with the Net-SNMP to see if we can get info from CPU and memory.
If you have worked with windows severs, I would like to ask you a couple of questions :
1- physycal memory information from windows 2000 systems is not available in NMIS, our local NMIS support told us this is because a constraint with SNMP protocol in that OS version; is there a way to work around this?
2- CPU utilization is shown for every cpu core, is there a way to get an average for the physical CPU? like the one %Processor time shows in Perfmon?
Alexander Zangerl
re 1, we've determined from saved snmp dumps that windows 2000 indeed does not export any memory stats via snmp. from NMIS' perspective there's no work around this lack of collectable information.
re 2, NMIS does currently not provide a cpu core average graph, but opts for precision and focussed collection instead (of course depending on whether your OS and snmp agent expose the cpus or cores separately); NMIS does, however, average the cpu load for calculation of the health metrics.
For more specialised collating and reporting we're offering our opReports product which does provide cpu average graphs, amongst many other advanced features; as far as i know your company does have an opReports installation.
Heine Pedersen
For sapi based scripts, please note that "expect" accepts regular expressions. So be sure to escape any special characters.
In our environment we need to check if an IMAP server sends "* OK", then we need to escape "*":
expect: \* OK
send: 1 LOGOUT
expect: OK LOGOUT
Alexander Zangerl
thanks for the note; i've updated the docs.