...
- See the current state of all systems from one place.
- See the history of all systems in one place.
- Provide operations teams with a single place to login and see what is happening.
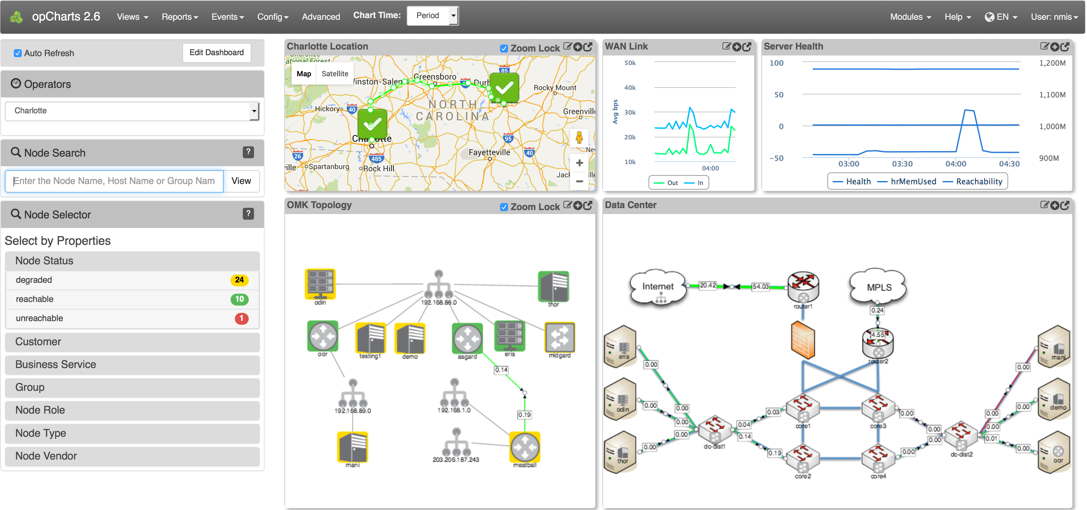
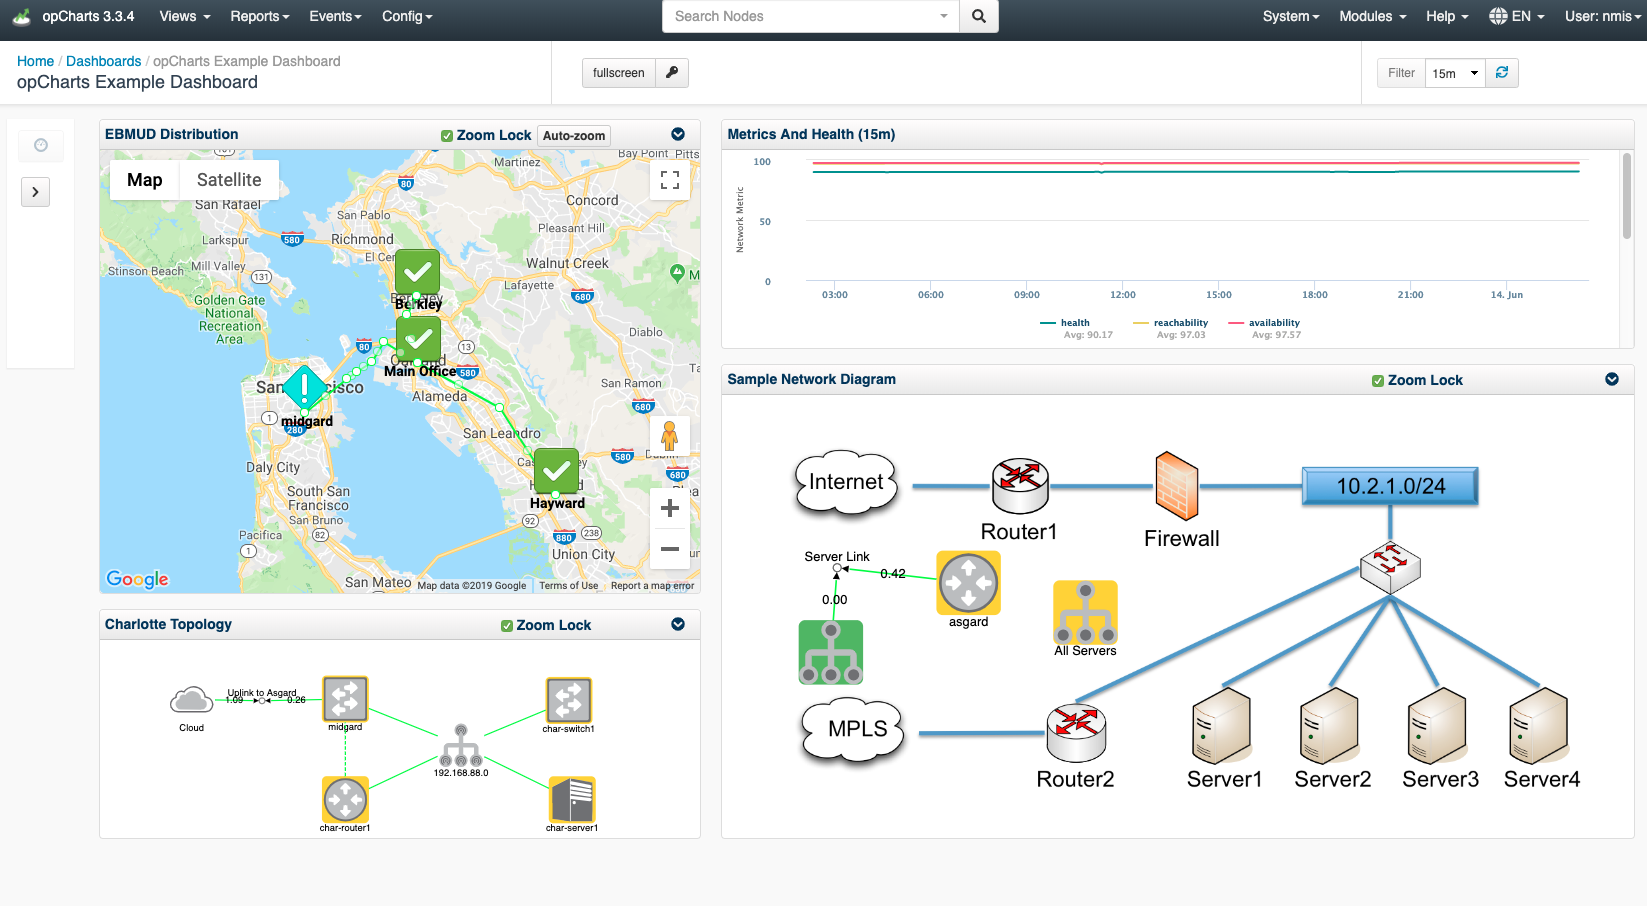
Example of a well-designed dashboard:
How to get a Single Pane of Glass using NMIS and opCharts
First, install NMIS there are two choices in going about doing this:
...
Opmantek Virtual Appliance Installation guide
Opmantek Virtual ApplianceMachine: Installation and Getting Started
After NMIS is installed you then need to Install/upgrade opCharts
Install/upgrade opCharts - opCharts Installation Guide
Get a free trial license key for opCharts - https://opmantek.com/opcharts-dashboards-charts-management/
...
...
Creating your Single Pane of Glass Dashboard
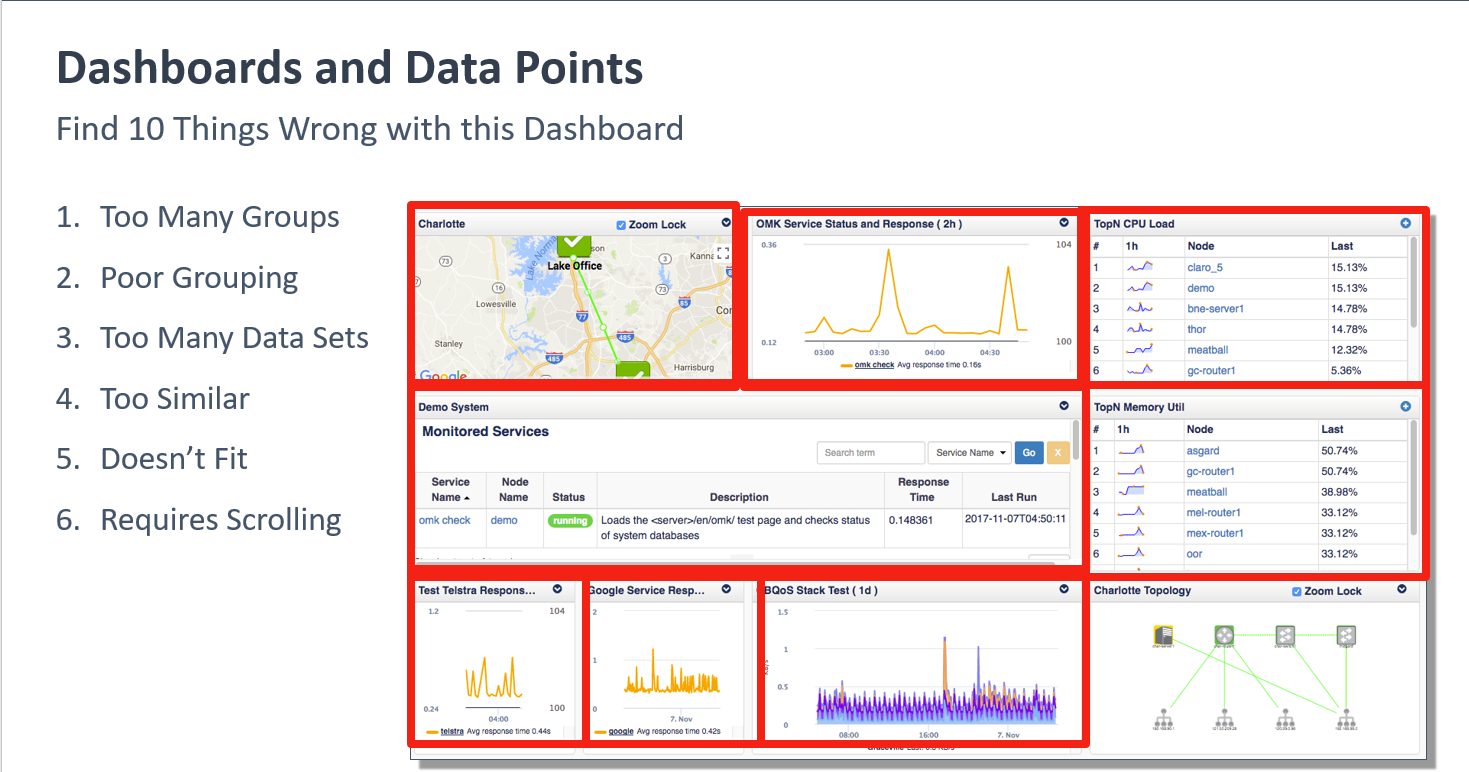
Now that you understand what separates a well designed and useful dashboard from a poorly designed one it's time to create your own.
Start by creating a new dashboard:
Navigate to menu -> Views -> Dashboards
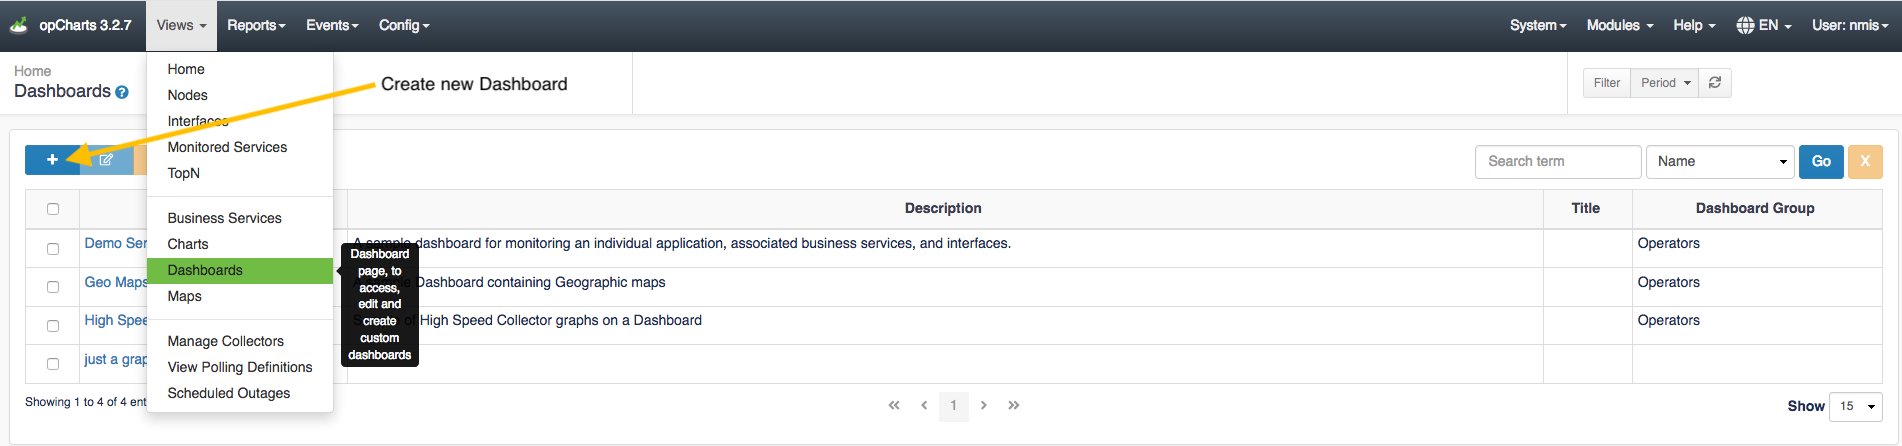
On the following screen, click the blue "+" icon to create a new dashboard
From this screen you can add data in one of two ways:
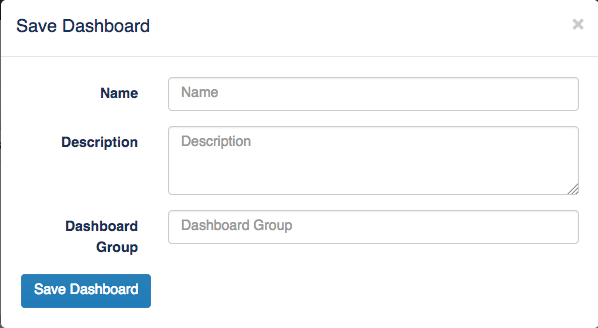
1. Go ahead and save the dashboard and give it a Name, Description, and assign it to a Dashboard Group if you would like. After this is complete, navigate to other views in opCharts that contains data you want to display on the chart. You can also begin adding components to the dashboard by clicking Add Component. A new Component Info box will open up and you can select the data you wish to display as well as change the size of the window to design the dashboard in a way you see fit.
For example, you may want to add a location you created in Maps on your dashboard by navigating to menu -> Views -> Maps then selecting a previously created map. Once on the Maps screen click the drop down menu on the top right of the map and select Add to Dashboard.
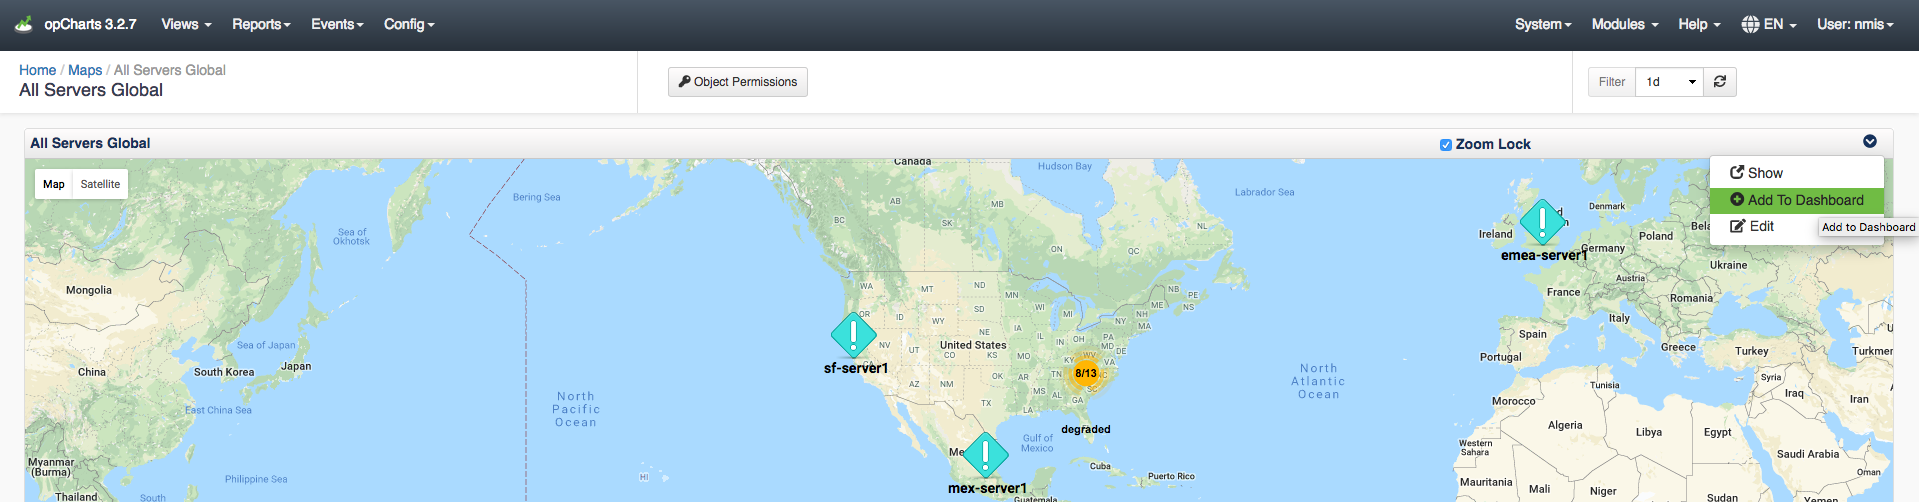
The Add Component to Dashboard menu will open up, select the Dashboard Name from the drop down menu that you wish to add the Map to then click Save. Once you navigate back to your saved Dashboard this map will be displayed. You can follow this same process as adding Maps to your dashboard when adding any other desired data points.
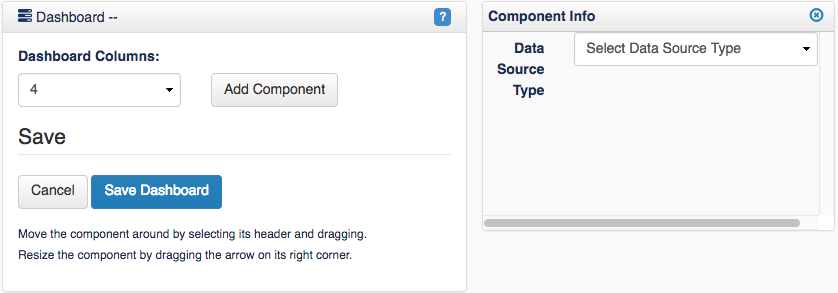
2. The second way to accomplish designing your Single Pane of Glass Dashboard is by starting from the New Dashboard screen, click the Add Component button. This will open up a Component Info menu allowing you to adjust the Width and the Height of the component you wish to add to your dashboard. After selecting the size you want to display this information on the dashboard, click the Data Source Type drop-down menu to select the desired data for the Dashboard. Once the Data Source Type is selected, another drop-down menu will appear allowing you to choose the specific data point you want to display on the Dashboard. You can repeat this process to organize and add as many Components to your Dashboard as you want.
...
More information on creating Dashboards can be found below:
Dashboards#CreatingaNewDashboard
Dashboard Design Considerations