Introduction
NMIS (Network Management Information System) was developed as an Open Source Network Management System to provide information to IT professionals to support decision making, both operational and longer term. The goal was to provide a dashboard of the all the nodes being managed in a single view so that it is possible to rapidly identify where problems are with "traffic lights". Over the years we have learnt that people see information differently, and while some people see colours and arrows other see data textually, so for some people the details are lost in the colours.
In NMIS 8.5.6G we have returned to this goal and wanted to help people to view the data in different ways. We have done this by providing a new way to see the status of all nodes, this was done by introducing a trinary status, instead of just a node being UP or DOWN, nodes are now reachable, degraded or unreachable.
This page will describe some details on this new feature as well as the concept of the NMIS modes of classes, coarse and fine-grained for viewing status.
Classic, Coarse or Fine-Grained
The NMIS dashboard has been working the same way for 15 years, and mostly people like it, that is the "classic" NMIS view, granular colours and information to help see the status of the network. However some people prefer a more coarse view, an Opmantek customer requested less granularity, that is if a node is down any node, don't be granular just make it be red and that way his operators would see it was red and act.
That gives us two dashboard modes, and we have a third optional mode, which is fine-grained. The fine-grained more is about nodes with "Reachable, Degraded and Unreachable" status, so you will see how many nodes are "down" being unreachable and how many nodes are degraded which means they are "up" but have some performance issue.
By default, NMIS8 will be in "classic" mode, you can select which mode you want with the new "Basic Setup" screen, reached from the menu "Setup -> Basic Setup", change the "Node Status Mode". The new Basic Setup screen looks like this:
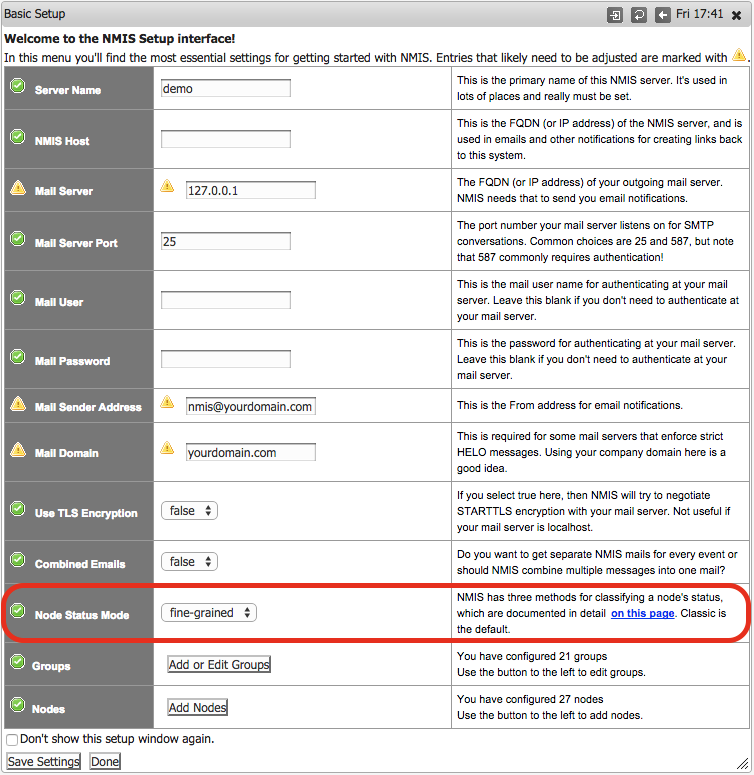
When you change these settings, it may take one polling cycle (5 mins) for the dashboard to fully reflect the new status.
Manual Configuration of Node Status Mode:
The configuration which relates to these modes are as follows and can be set in Config.nmis or Config.json
| classic mode | coarse mode | fine-grained mode | |
|---|---|---|---|
| node_status_uses_status_summary | false | false | true |
| display_status_summary | false | false | true |
| overall_node_status_coarse | false | true | false |
e.g. fine-grained mode
'node_status_uses_status_summary' => 'true',
'display_status_summary' => 'true',
'overall_node_status_coarse' => 'false',
Reachable, Degraded and Unreachable
The new optional trinary status provides an additional level of detail, this means:
REACHABLE Reachable - Node is ping-able and has no detected proactive or alert events
DEGRADED Degraded - Node is ping-able but SNMP is not responding or one or more proactive or alert events have been detected.
UNREACHABLE Unreachable - Node is NOT responding to ICMP or SNMP packets.
So the new status is Degraded, this is there to reflect the KPI's for a node and show you that the node is up and working, but has some other performance condition active. Please read:
Calculating and affecting Node degraded status
The Gory Details of Classic Mode
Level Status - Normal, Warning, Minor, Major, Critical
      'node down' => {
        'core' => {
          'logging' => 'true',
          'level' => 'Critical'
        },
        'access' => {
          'logging' => 'true',
          'level' => 'Major'
        },
        'distribution' => {
          'logging' => 'true',
          'level' => 'Major'
        }
      },
How these get calculated? % NodeUp (NodeDn) + role weight (access vs core)?
$status_number = 100 * $statusHash{Normal};
$status_number = $status_number + ( 90 * $statusHash{Warning} );
$status_number = $status_number + ( 75 * $statusHash{Minor} );
$status_number = $status_number + ( 60 * $statusHash{Major} );
$status_number = $status_number + ( 50 * $statusHash{Critical} );
$status_number = $status_number + ( 40 * $statusHash{Fatal} );
if ( $status_number != 0 and $statusHash{count} != 0 ) {
	$status_number = $status_number / $statusHash{count};
}
if ( $status_number == 100 ) { $overall_status = "Normal"; }
elsif ( $status_number >= 95 ) { $overall_status = "Warning"; }
elsif ( $status_number >= 90 ) { $overall_status = "Minor"; }
elsif ( $status_number >= 70 ) { $overall_status = "Major"; }
elsif ( $status_number >= 50 ) { $overall_status = "Critical"; }
elsif ( $status_number <= 40 ) { $overall_status = "Fatal"; }
elsif ( $status_number >= 30 ) { $overall_status = "Disaster"; }
elsif ( $status_number < 30 ) { $overall_status = "Catastrophic"; }